
Table of Contents
West Nile virus is one of those diseases people hear about every summer and then mostly forget about until a local outbreak pops up somewhere. And then the same question comes back again: how deadly is it, really?
The answer is a little messy. Because the West Nile virus mortality rate is not one clean number. Not even close. It changes by country, by age, by how aggressively a place tests, and honestly by how good the surveillance system is in the first place.
West Nile Virus Mortality: The Global Concern
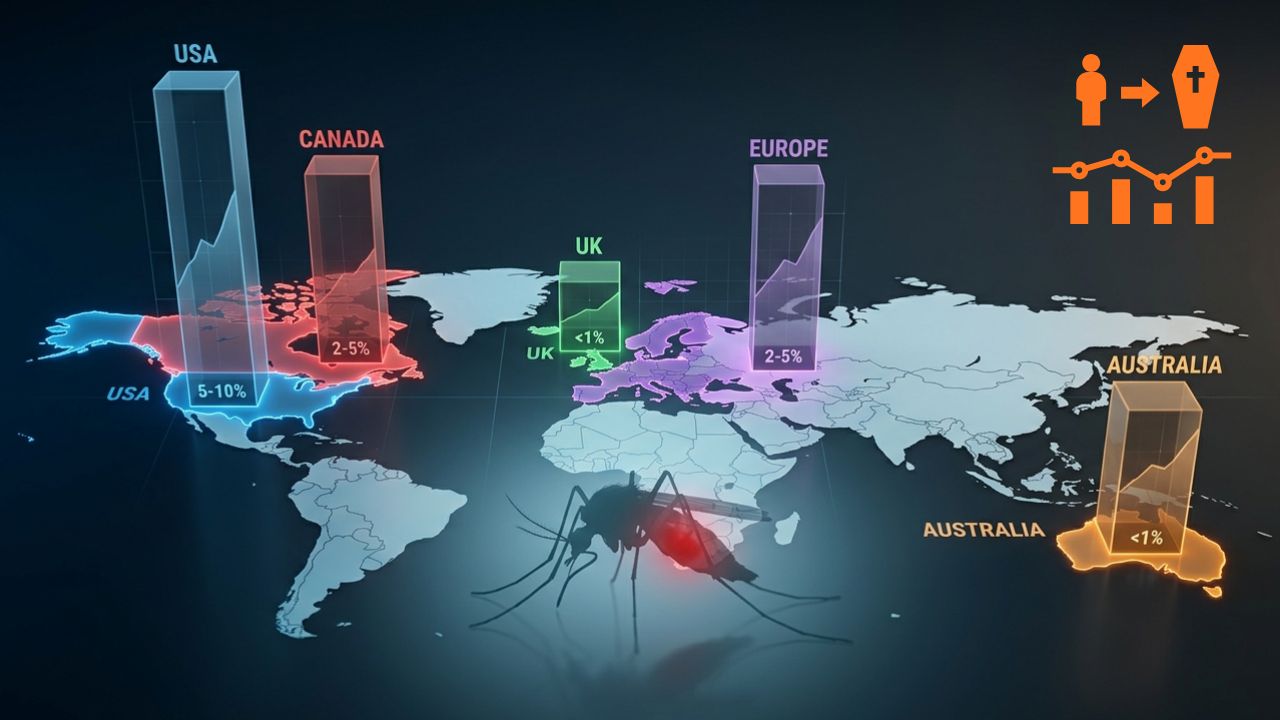
If you compare the US, Canada, the UK, Europe, and Australia, the US is the clearest example of a country with a substantial and well-documented West Nile burden. Europe is more uneven — some areas see real seasonal activity, other areas barely do. Canada has had meaningful activity too, but often with fewer total cases than the US. The UK and Australia usually report far fewer human deaths, though that does not mean zero risk, just less sustained transmission or less visible circulation.
That is the part people miss. They look at reported deaths and assume the virus itself must be wildly different from place to place. It usually is not. The bigger difference is the surveillance, the ecology, the age profile of the cases, and whether the country is catching mild infections or only the severe ones.
What Mortality Rate Actually Means Here…
Before comparing countries, one thing has to be said plainly: West Nile “mortality rate” usually means case fatality ratio, not death rate in the general population.
That distinction matters a lot.
A case fatality ratio tells you how many reported cases die. But West Nile infections are often silent. CDC surveillance notes that around 70%–80% of infections are asymptomatic. So if most infections never get counted, the mortality rate among reported cases can look much higher than the true risk among all infected people.
That is why this disease produces confusing headlines. A place can have a low number of reported cases and still have a pretty serious fatality proportion among the cases it does detect. Or the reverse, sometimes. More testing usually changes the picture more than people expect.
West Nile Virus Mortality Rate Comparison
1. United States
The US has the most detailed surveillance structure in this comparison, and that matters more than people think. CDC’s ArboNET system tracks human disease, mosquito pools, dead birds, sentinel animals, and even presumptive viremic blood donors. That gives the US a much more complete seasonal picture than many countries have.
Now the mortality side. In CDC surveillance from 2009–2018, the overall case fatality ratio for neuroinvasive disease was 9%. But the age pattern is the real story. Fatality was about 2% in patients under 50, 6% in ages 50–69, and 21% in people 70 and older. That is a sharp climb, not a gentle one.
So when people say “West Nile is usually mild,” that is true for many infections. But it is also a little misleading. Mild in the overall sense does not mean harmless for older adults. The severe end of the spectrum is where the deaths happen, and that severe end is very age-weighted.
Age-specific West Nile Virus Mortality Risk in the US
| Age group | Case fatality ratio | Interpretation |
|---|---|---|
| Under 50 | 2% | Deaths are uncommon but not impossible; most infections are mild or unnoticed. |
| 50–69 | 6% | Risk rises clearly once age and comorbidity start stacking up. |
| 70+ | 21% | Highest documented fatality risk in CDC surveillance. |
2. Canada
Canada’s West Nile pattern is similar in the basic biology, but the size of the burden has often been smaller than in the US. That does not make it trivial. It just means the total number of infections and deaths is usually lower in most years, though some prairie regions have had substantial activity.
Climate and geography matter a lot here. In parts of the Canadian prairies, conditions have supported meaningful transmission, especially where mosquito habitat and bird movement line up in the wrong way. The virus can absolutely produce serious human disease in Canada. It already has.
But the mortality comparison still tends to favor a lower reported burden than the US overall, and that is partly because there are fewer outbreaks and fewer diagnosed cases. Again, that doesn’t automatically mean the underlying fatality risk is lower. It often just means the denominator is smaller.
3. United Kingdom
The UK usually sits at the low end of the comparison, at least in terms of reported human deaths. That should not be read as “the UK is immune” because that would be too neat, and nature is rarely neat. It’s more that sustained local circulation has not become as established there as it has in North America or parts of Europe.
A lot of the UK conversation is about preparedness, not a large ongoing mortality burden. Surveillance and diagnostic intensity matter here too. If clinicians are not looking for West Nile very often, they will not find many cases. If mosquito ecology changes, that can shift. Fast, even.
4. Europe
Europe is probably the hardest region to summarize in one sentence because the pattern is so patchy.
Some parts of Europe see recurring seasonal transmission. Others do not. ECDC documents describe a mixed surveillance system where passive surveillance often relies on human case detection and dead animals, while active surveillance includes mosquitoes and sentinel systems. So the map is never perfectly clean.
A wider European retrospective study from 2006–2021 reported 2,916 neuroinvasive cases and 383 deaths. That worked out to a 13.1% fatality proportion among neuroinvasive cases in that dataset. That number is not a general West Nile fatality rate for all infections, and it should not be used that way. But it does show how severe the neuroinvasive end can be.
This is one of those situations where the reported mortality rate can look high because it mostly reflects the sickest patients. Which is exactly the point. The surveillance system is often catching the severe cases first, and mild cases are likely slipping through.
5. Australia
Australia is a different story again.
It is usually discussed through the West Nile complex and Kunjin-related activity rather than the kind of widespread annual human mortality seen in the US. Human deaths are far less commonly reported, and the overall burden is much lower than in North America.
That doesn’t mean the risk is fake or purely theoretical. It just means the ecology is different and the transmission pattern is not the same. Australia has mosquito-borne disease challenges, yes, but classic West Nile mortality is not one of the big recurring headline issues in the way it is in parts of the US or Europe.
Side-by-side comparison
| Region | Typical human mortality pattern | Surveillance strength | Main reason rates look different |
|---|---|---|---|
| US | Highest visible burden, with deaths concentrated in older adults and neuroinvasive cases | Very strong | More transmission, more testing, more complete case detection |
| Canada | Lower total deaths than the US, but similar age-risk pattern | Strong | Fewer outbreaks and fewer total cases in most years |
| UK | Usually rare human deaths | Moderate | Limited sustained local transmission and low case volume |
| Europe | Highly variable by country and season | Uneven but improving | Patchy transmission and mixed surveillance intensity |
| Australia | Very limited human mortality in classic WNV terms | Targeted | Ecology and transmission patterns differ from North America |
Surveillance method comparison
| Region | Main surveillance style | What it catches best | Weak spot |
|---|---|---|---|
| United States | Human cases + mosquito pools + dead birds + sentinel data | Early seasonal signals and outbreak spread | Mild human infections still get missed |
| Europe | Passive human case detection plus dead animals; active mosquito and sentinel surveillance in some countries | Regional outbreaks, seasonal spread | Uneven country-to-country consistency |
| Canada | Regional public health surveillance with outbreak-driven attention | Localized transmission in active provinces | National comparability can be uneven |
| UK | More limited routine local human detection | Imported or sporadic cases | Low-volume transmission can hide cases |
| Australia | Targeted arbovirus surveillance | Localized mosquito-borne threats | Not built around the same classic WNV burden as North America |
| Country / Region | Latest available period | Reported cases | Reported deaths | Case fatality rate | Mortality level |
|---|---|---|---|---|---|
| United States | 2025 provisional season | Provisional; updated during season | Provisional; updated during season | Varies by final season total | High |
| Canada | Latest available public summaries | Not consistently consolidated nationally | Not consistently consolidated nationally | Not reliably comparable in one national series | Moderate |
| United Kingdom | Latest available public summaries | Rare / sporadic | Rare / sporadic | No stable national CFR | Low |
| Europe | 2025 continent-wide reporting | 1,112 locally acquired cases | 97 deaths | 8.7% | High |
| Italy | 2025 outbreak peak | 779 confirmed cases | 72 deaths | 9.2% | High |
| Australia | Latest available public summaries | Very limited classic WNV burden | Very limited classic WNV burden | No stable national CFR | Low |
Why the Numbers Do Not Line Up Neatly
This is the part where people want a clean ranking, and sorry, it rarely works that way.
There are at least four reasons West Nile mortality comparisons look uneven across countries:
- Surveillance intensity differs.
- Diagnostic testing differs.
- Age structure of cases differs.
- The share of neuroinvasive disease differs.
A country that does more active surveillance will usually find more mild infections. That can lower the apparent case fatality ratio. A country that mostly detects hospitalized patients will usually show a higher ratio because it is only seeing the tip of the iceberg.
So yes, reported mortality can be real. But it is also partly a reflection of what is being caught.
That is just how surveillance works. Not elegant, but honest.
What Factors Changes the Mortality Number
| Factor | Effect on mortality data |
|---|---|
| Older age | Raises case fatality sharply. |
| Neuroinvasive disease | Accounts for most deaths. |
| Mild case underreporting | Makes fatality rates look higher than the true infection fatality risk. |
| Better surveillance | Often lowers the apparent fatality ratio by catching more mild infections. |
| Climate warming | Can expand seasonal transmission windows and local suitability. |
Age-specific Risk is the Real Pattern
If there is one pattern that repeats across the US, Canada, and Europe, it is this: older adults are at much higher risk of death once severe disease develops.
CDC guidance says incidence of neuroinvasive disease increases with age, and older adults are more likely to develop encephalitis or meningoencephalitis and have substantially higher case fatality rates. That same general pattern shows up in US surveillance data and European studies too.
The practical takeaway is blunt:
- Younger people can still get infected, obviously.
- Most infections may be mild or unnoticed.
- The deaths cluster in older adults, especially when the infection reaches the nervous system.
That’s the important thing. Not just “West Nile kills,” but who it kills, and under what clinical conditions.
Underreporting West Nile Virus Cases Changes Everything
West Nile Virus cases has a major undercount problem. A serious one.
Because most infections are asymptomatic, and many symptomatic cases are mild, a lot of infections never enter official statistics. CDC surveillance systems do a good job compared with many countries, but even then, the reported case counts are still only a slice of reality.
This creates a weird statistical effect. A place can appear to have a high mortality rate because only the sickest patients were tested. Another place may look safer because more low-severity infections were caught. Same virus, different picture.
That is why public health analysts often use multiple measures together:
- neuroinvasive disease incidence.
- reported deaths.
- mosquito infection data.
- seasonal timing.
- age distribution of cases.
One number never tells the whole story. It almost never does.
Climate is Not a Side Issue Anymore
Climate now sits right in the middle of the West Nile conversation.
Temperature, precipitation, drought, and seasonal length all affect mosquito activity and virus transmission. Reviews and modeling studies have repeatedly found that warmer temperatures can speed mosquito and viral development, while drought and precipitation patterns can change where mosquitoes and birds concentrate.
In the US, warm temperatures are tied to the classic summer transmission season, usually between June and September. That is when mosquito life cycles accelerate and human exposure goes up. Some studies have even linked temperature increases to significantly higher reported WNV incidence.
Europe is shifting too. New modeling work suggests climate change is expanding ecological suitability in parts of the continent. That does not mean every country will see the same increase. It means the risk map is changing, unevenly, and probably faster than many health systems would like.
Australia and the UK are not outside this either. If climate and land use keep changing, the distribution of mosquitoes and spillover risk can change too. Not overnight. But enough to matter.
How Healthcare Systems Affect Deaths
Healthcare does not stop the mosquito bite. But it does shape what happens after.
Places with strong surveillance, good clinician awareness, and fast reporting are more likely to catch outbreaks early. That can lead to quicker mosquito control, more public warnings, and better protection for older adults.
Treatment is still mostly supportive. There is no simple cure that erases the mortality risk once neuroinvasive disease has developed. So prevention is doing a lot of work here — mosquito control, bite avoidance, and seasonal awareness. That’s the unglamorous answer, but it’s the right one.
In practice, the countries that respond best are usually the ones that already expect the virus to show up.
That sounds obvious. It is obvious. But public health is full of obvious things that matter.
So Which Region Has the Highest West Nile Virus Mortality rate?
If you mean reported West Nile mortality among diagnosed cases, the US and some parts of Europe generally show the most visible burden, especially because they have established surveillance and real seasonal transmission.
If you mean true infection fatality, the answer is less tidy, because hidden infections are everywhere and the denominator is always uncertain. Canada likely sits somewhere in the same broad risk family as the US in vulnerable groups, while the UK and Australia usually have lower observed human mortality because transmission is less established or less frequent.
The cautious public health answer is this:
West Nile mortality is highest where transmission is active, older adults are exposed, neuroinvasive disease is being detected, and surveillance is good enough to count the dead honestly.
Bottom line
West Nile virus is not a single mortality number. It is a layered pattern.
The US has the strongest surveillance and a clearly documented age-driven fatality pattern. Europe is highly variable and increasingly climate-sensitive. Canada has real risk, especially in certain regions. The UK and Australia usually show lower reported mortality, but that is tied to ecology and surveillance, not magic.
If you remember only one thing, make it this: older age is the biggest consistent predictor of death, and surveillance quality is the biggest reason mortality rates look different between countries.
Editorial Team & Contributors

Raashid Ansari, Founder, Content Researcher & Author - MosquiTalk
Not an entomologist — just a genuinely curious writer who started researching mosquitoes and couldn't stop. What began as casual reading about repellents and bite prevention gradually turned into a deep ongoing dive into vector biology, disease epidemiology, animal health impacts, and the real science behind mosquito control. Everything published here is carefully edited, and written with one purpose: giving readers accurate, accessible information they can actually trust and use to protect themselves, their families, and their pets, birds and cattle.
Active across social platforms, regularly publishes, and genuinely invested in spreading mosquito awareness where it matters most. Because informed readers make better decisions — and better decisions save lives.