
Table of Contents
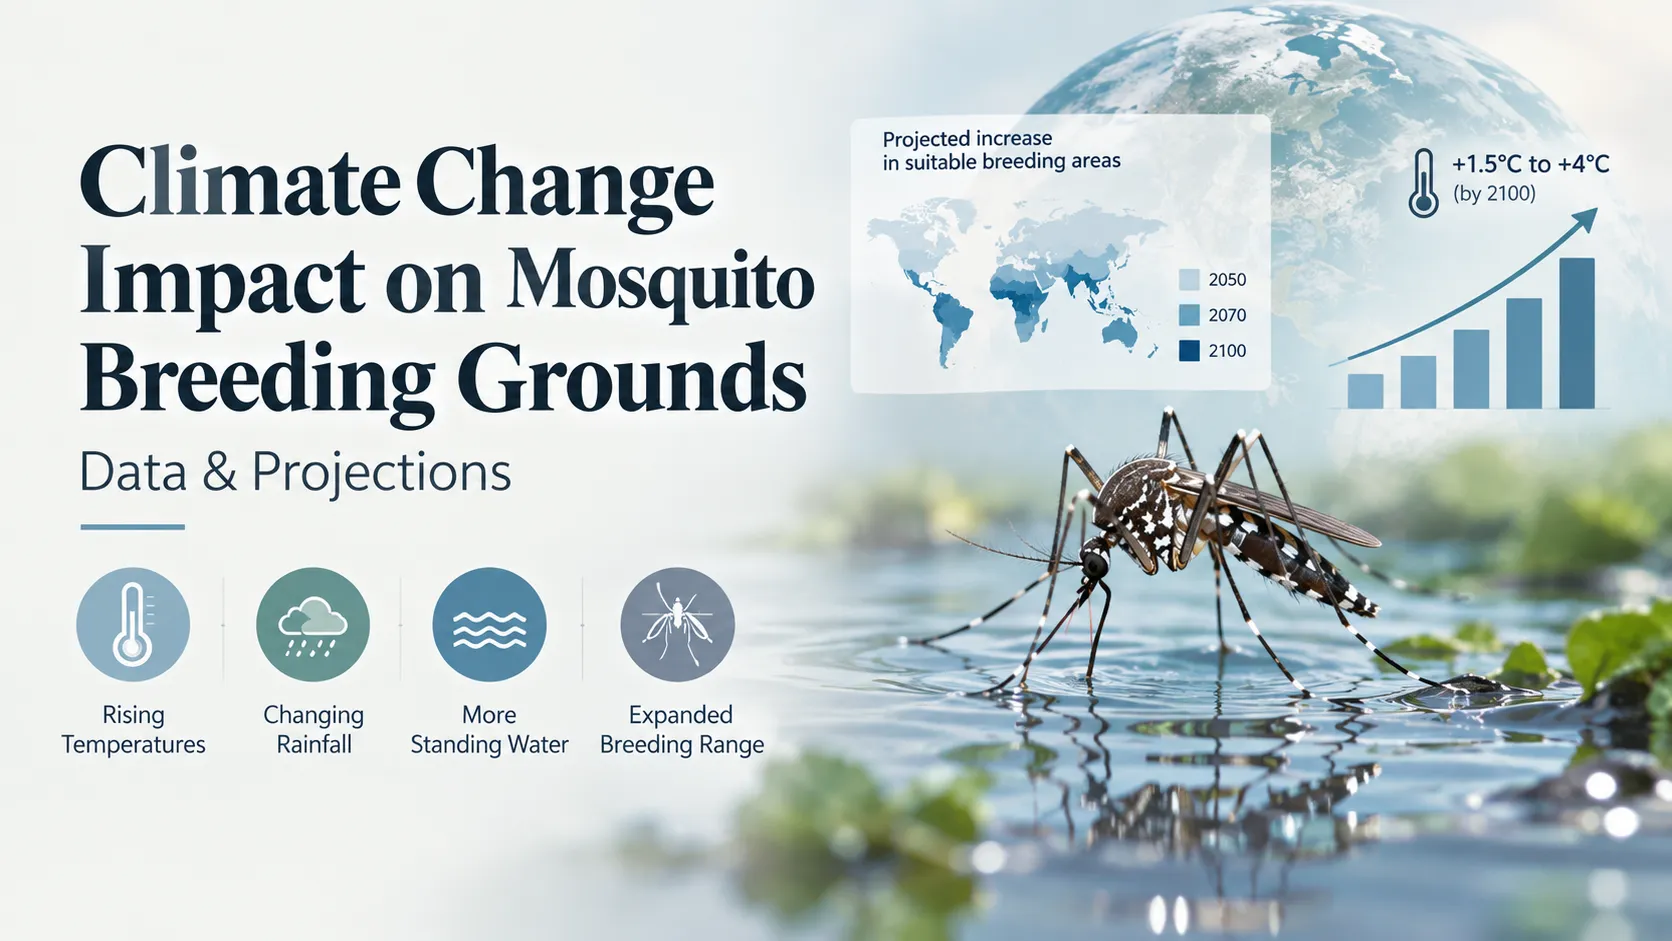
Key Takeaways on Impact of Climate Change on Mosquito Breeding Grounds
1. Introduction
Mosquito-borne diseases remain among the largest infectious burdens on Earth. The World Health Organization estimated 282 million malaria cases and 610,000 deaths in 2024, roughly 9 million more cases than the year before, with the African Region carrying about 94% of cases (WHO, World Malaria Report 2025). Dengue is now the fastest-growing arboviral disease: 6.5 million cases were reported to WHO in 2023, then a record 14.1 million cases and 9,508 deaths in 2024, a twelve-fold rise over a decade (Haider et al. 2024, 2025).
Reported cases undercount reality; modelling studies put annual dengue infections on the order of 400 million, most of them mild or unrecorded (Bhatt et al. 2013). Chikungunya, Zika, West Nile virus, Japanese encephalitis and lymphatic filariasis add to the toll.
None of these numbers can be blamed on climate alone. Immunity, travel, urbanisation, drug and insecticide resistance, conflict, and funding all play large roles. But climate acts on the one thing every one of these diseases has in common: a small aquatic insect that must find standing water, warm enough and wet enough, to complete its life cycle.
This article asks a specific question: how does a warmer, wetter-in-places, drier-in-others, and more erratic climate change where, when and how intensely mosquitoes breed? We start with the biology, move through the climate drivers and regional geography, then look at real cities, and only then turn to data tables and projections.
2. Climate Change and Mosquito Populations: The Biology Behind the Problem
2.1 A life cycle split between water and air
Every mosquito passes through four stages in their life cycle: egg, larva, pupa, adult. The first three are aquatic; only the adult flies. Females need a blood meal to develop eggs, and this creates the gonotrophic cycle: feed, digest and mature eggs, lay eggs, repeat. Only females bite.
The larva (four growth stages, called instars) feeds on microorganisms and organic particles in the water. The pupa does not feed; over one to a few days, depending on temperature, it transforms into the adult, which emerges at the water surface. The practical consequence is that the size of a mosquito population depends on how much suitable water exists, how warm it is, and how long it lasts. Climate changes all three.
- RainfallRising water triggers hatching; heavy rain refills containers.
- HumiditySets how long dry eggs survive.
- TemperatureCold triggers dormant (diapause) eggs in temperate Ae. albopictus.
- TemperatureSets development speed and survival.
- RainfallCreates and refreshes habitat; extreme rain can flush larvae out.
- SalinityMost freshwater species decline as water turns brackish; some coastal species thrive.
- TemperatureControls how quickly adults emerge.
- RainfallWater must last long enough to finish the stage.
- TemperatureDrives survival, biting rate and how fast the pathogen matures (EIP).
- HumidityDry air shortens life; humid air favours survival.
- RainfallSets next generation’s habitat, with a lag of weeks.
2.2 The main vectors and where they breed
Three genera do most of the damage, and they do not breed in the same places.
- Aedes aegypti and Aedes albopictus (dengue, chikungunya, Zika, yellow fever) are container breeders. They lay eggs just above the waterline on the walls of small containers (water storage jars, buckets, tyres, flowerpot saucers, roof gutters, air-conditioner trays). Eggs can survive drying for months and hatch when water rises to cover them. Both bite mainly by day and live close to people. Ae. aegypti is the more domestic, more heat-tolerant species. Ae. albopictus uses natural containers such as tree holes and cut bamboo as well as artificial ones, and temperate populations produce diapausing eggs (a dormant, cold-hardy state triggered by shortening days) that let it survive winters.
- Anopheles (malaria) females lay eggs singly on the water surface. An. gambiae and relatives generally favour clean, sunlit, shallow, often temporary pools: puddles, hoof prints, edges of streams, brick pits. An. stephensi, the main urban malaria vector in South Asia, is different: it breeds in overhead tanks, wells, cisterns and construction-site water. It has been detected in Djibouti (2012), Ethiopia and Sudan (2016), Somalia (2019), Nigeria (by 2020) and Kenya (2022), and modelling identifies African cities as at risk from it (Sinka et al. 2020).
- Culex quinquefasciatus and Culex pipiens (West Nile virus, lymphatic filariasis) lay egg rafts and prefer water rich in organic matter: blocked drains, septic systems, latrines, polluted ponds. (Japanese encephalitis is mainly carried by another Culex species, Cx. tritaeniorhynchus, which breeds in flooded rice fields.)
2.3 Why temperature controls everything: ectotherms and the extrinsic incubation period
Mosquitoes are ectotherms: their body temperature follows the environment, so nearly every rate in their lives is temperature-dependent: how fast eggs and larvae develop, how long adults live, how often females bite, and how quickly a pathogen matures inside them.
That last process is the extrinsic incubation period (EIP): the time from when a mosquito ingests an infected blood meal to when it can transmit the pathogen. For dengue virus, a meta-analysis estimated a mean EIP of about 15 days at 25 °C but only 6.5 days at 30 °C (Chan & Johansson 2012).
This matters because an adult female mosquito in the wild often lives only a couple of weeks. A pathogen that needs 15 days can only be passed on by the unusually long-lived; one that needs 6.5 days can be passed on by most. A five-degree change can therefore change transmission far more than it changes mosquito numbers.
2.4 The hump-shaped response, and why “warmer” does not always mean “worse”
Every trait above has a temperature at which it peaks and limits beyond which it collapses. Combined, they produce a unimodal (hump-shaped) thermal response of transmission. Mechanistic models fitted to laboratory data and checked against human case data find, for dengue, Zika and chikungunya transmitted by Aedes, that transmission occurs between roughly 18 and 34 °C with a maximum at 26–29 °C (Mordecai et al. 2017).
For Zika in Ae. aegypti the optimum is 29 °C, with a range of 22.7–34.7 °C (Tesla et al. 2018). For malaria, the optimum is much lower, around 25 °C (Mordecai et al. 2013; Villena et al. 2022), and West Nile virus and five other temperate mosquito-borne viruses peak between 23 and 26 °C (Shocket et al. 2020).
The implication is central to this whole topic. In a cool place, warming moves temperatures towards the optimum and raises suitability. In a place already near the optimum, further warming can reduce it. That is why a highland town may become newly suitable while the hottest lowlands see little gain or even decline (Tesla et al. 2018; Ryan et al. 2019).
Two refinements are worth knowing. First, models usually use mean temperature, but mosquitoes experience daily swings, and large daily temperature ranges can change transmission relative to a constant temperature with the same mean (Lambrechts et al. 2011). Second, a mosquito can shelter in a cooler, humid spot such as a shaded room or drain, so its “personal” microclimate can differ from the weather station reading (Paaijmans et al. 2010).
2.5 Humidity, egg desiccation and vectorial capacity
Humidity governs adult survival. Dry air increases water loss; hot, dry conditions shorten adult life and push mosquitoes to seek shelter, while humid conditions favour survival and host-seeking. The other side of this is egg desiccation resistance in Aedes: eggs laid before a dry spell wait, then hatch in synchronised waves when heavy rain refills containers. This is one reason erratic rainfall, with long dry spells broken by downpours, can produce sudden surges.
Epidemiologists combine these traits into vectorial capacity: roughly, the number of infectious bites a mosquito population delivers per case per day. In the classical Ross–Macdonald form it is proportional to mosquito density × (biting rate)² × the probability an infected mosquito transmits × e^(−mortality × EIP) ÷ mortality. Biting rate is squared, and survival through the EIP sits in an exponent, which is why small temperature changes have outsized effects.
3. How Climate Change Alters Breeding Grounds: The Drivers
(i) Rising mean temperature and warmer nights. Greenhouse warming is not uniform: night-time minima have risen faster than daytime maxima in many regions. Warmer nights matter because cold nights, not hot afternoons, limit mosquitoes in cool regions.
Effect: increase in cool zones, mixed near the optimum, possible decrease above about 34 °C.
Confidence: high for the physiological response, medium for local outcomes.
(ii) Changing rainfall: heavier downpours, longer dry spells, shifting monsoons. A warmer atmosphere holds more water vapour, so when it rains it tends to rain harder, and dry spells can lengthen between events. Heavy rain fills containers, drains and puddles; very heavy rain can also flush larvae away, so the immediate effect can be a short-term dip followed by a rebound as pools stabilise. Shifts in monsoon onset and withdrawal change when breeding starts and stops.
Effect: usually an increase, with strong regional differences and timing lags.
(iii) Flooding and stagnant post-flood pools. Floods create vast temporary habitat in low-lying land, and receding waters leave isolated pools that suit Culex and Anopheles. Post-flood surges in vector-borne disease have been reported in several regions, though attributing any single outbreak to a single flood is difficult.
(iv) Drought and its paradox. Less rain does not mean fewer mosquitoes. Where piped supply fails, households store water in drums, tanks and buckets, which is prime Aedes habitat. The 2014–15 water crisis in São Paulo, when many households stored water, was followed by a very large dengue season, and water storage is a plausible contributor, although it is hard to isolate from other factors. In rural Africa, shrinking rivers break into isolated pools in riverbeds that can suit Anopheles.
Effect: mixed and setting-dependent.
(v) Humidity and vapour pressure. Where warming outpaces moisture, the air can get drier at the same time as hotter, reducing adult survival; where moisture rises with temperature, survival is helped.
Effect: mixed.
(vi) Sea-level rise and salinity. Rising seas and storm surge push brackish water into coastal pools and aquifers. Salt-tolerant species such as Aedes taeniorhynchus and Ae. sollicitans (salt marshes of the Americas), Ae. detritus (Europe), and the malaria vectors An. sundaicus (brackish coastal Asia) and An. melas/An. merus (African coasts) may gain habitat, while freshwater breeders lose some. Even Ae. aegypti larvae have been found developing in brackish water in coastal Sri Lanka (Ramasamy et al. 2011).
Effect: mixed, with species turnover.
(vii) ENSO and other oscillations. El Niño and La Niña shift rainfall and temperature across whole regions. Links to dengue incidence have been documented in Thailand, Mexico and Puerto Rico (Johansson et al. 2009), and the 1997–98 El Niño floods in East Africa preceded a large Rift Valley fever epidemic (Linthicum et al. 1999). Climate change may alter ENSO behaviour, but that projection remains uncertain.
(viii) Altitude and latitude. Because air cools by about 6.5 °C per kilometre of altitude, one degree of warming raises the “same temperature” line by about 150 m. Malaria incidence in highland Ethiopia and Colombia has been shown to shift upward in warmer years (Siraj et al. 2014), although the causes of highland trends are debated, since land use, drug resistance and health services also change. At high latitudes, Ae. albopictus has spread northwards in Europe; one 2025 analysis estimated the northern edge of its establishment advancing at roughly 60 km per year (Lancet Planetary Health, 2025).
- Rule of thumb: air cools about 6.5 °C per kilometre of altitude, so each 1 °C of warming lifts a given temperature line by roughly 150 m.
- Highland malaria (model): under the highest-emission scenario, tropical areas above 1,000 m could gain up to 1.6 suitable months for malaria by 2070–2099 (Colón-González et al. 2021).
- Highland malaria (observed/modelled): climate suitability in highland areas rose 13.9% (P. falciparum) and 13.0% (P. vivax) between 1951–60 and 2015–24 (Lancet Countdown, 2025 data).
- Poleward, Europe: the northern edge of Ae. albopictus establishment was estimated to be advancing about 60 km per year by 2025 (Lancet Planetary Health, 2025).
(ix) Shorter winters and longer seasons. Milder winters raise overwintering survival and start the breeding season earlier, extending the annual window in which transmission is possible.
4. Geography and Weather: Six Climate Regimes
The same climate signal produces different outcomes depending on the starting point.
- Warm, wet year-round (equatorial/tropical)
- Highland / subtropical frontier
- Temperate zone
- Newly suitable band, today vs. projected
1) Equatorial and humid tropical (Amazon, Congo basin, Indonesia, Malaysia). Warm and wet all year, so mosquitoes breed all year. The story here is intensification, not expansion: more intense rainfall peaks, hotter urban cores near the thermal ceiling, and rapid urbanisation.
2) Monsoon tropical and subtropical (South Asia, Southeast Asia, the West African Sahel fringe). Breeding is tightly tied to rainfall onset. Cases typically lag rain by weeks, because pools must form, larvae must develop, adults must feed and the pathogen must complete its EIP. Shifts in monsoon timing and intensity, plus longer warm seasons, are the key climate levers. Some studies project dengue transmission seasons in tropical lowland areas of Southeast Asia, sub-Saharan Africa and the Indian subcontinent lengthening by up to four months under the highest-emission scenario (Colón-González et al. 2021).
3) Semi-arid and arid (Sahel, Thar fringe, Horn of Africa). Breeding depends on episodic rain and on human water storage. A single heavy rain year can trigger epidemics in a population with little immunity. Very high temperatures reduce adult survival, so the projected effect of warming here is mixed.
4) Highland and montane (Kenyan and Ethiopian highlands, Andean valleys, Himalayan foothills). The temperature-limited frontier. Cool nights slow larval development and lengthen the EIP so much that transmission fails. Warming pushes these thresholds upward. One modelling study estimated that, under the highest emissions, tropical areas above 1,000 m in places such as Ethiopia, Angola, South Africa and Madagascar could gain up to 1.6 additional suitable months for malaria by 2070–2099 (Colón-González et al. 2021). Populations there often have little immunity, so outbreaks can be severe.
5) Temperate and Mediterranean (southern Europe, the US Mid-Atlantic and Southeast, temperate East Asia, southern Australia). Newly suitable zones for Ae. albopictus. Even where vectors are established, transmission windows in temperate climates are short: models suggest at most about three months per year (Mordecai et al. 2017).
Warming lengthens these windows, and introductions via used-tyre trade, transport and travel supply the virus. Europe has moved from isolated events to recurrent local transmission: in October 2024, Italy recorded the largest dengue outbreak in Europe, with more than 200 confirmed local cases, and 2025 brought an unprecedented number of locally acquired chikungunya outbreaks (Lancet Planetary Health, 2025).
6) Coastal and deltaic (Bangladesh, Mekong, Nile delta, US Gulf Coast). Flooding, storm surge and salinity intrusion interact with dense populations. Effects are mixed by species, but the flooding-and-displacement pathway usually raises risk.
A note on microclimate. Climate models work on grids many kilometres wide. A mosquito lives in a stairwell, a rooftop tank or a shaded drain. Water in a small dark container can be cooler by day and warmer by night than air temperature, and indoor conditions differ again. Regional averages therefore locate risk but do not resolve it.
| Region | Warmer temperature | Heavier rain / monsoon shifts | Drought & water storage | Flooding | Sea-level rise & salinity | Humidity change |
|---|---|---|---|---|---|---|
| Equatorial humid tropics | Mixed | Moderate increase | Weak increase | Moderate increase | Weak increase | Little change |
| Monsoon South & Southeast Asia | Moderate increase | Strong increase | Moderate increase | Strong increase | Weak increase | Weak increase |
| Sahel & semi-arid zones | Mixed | Moderate increase | Mixed | Moderate increase | Little change | Decrease |
| Highlands (East Africa, Andes, Himalayan foothills) | Strong increase | Moderate increase | Mixed | Weak increase | Little change | Weak increase |
| Temperate (S. Europe, US, temperate E. Asia) | Strong increase | Moderate increase | Mixed | Weak increase | Weak increase | Mixed |
| Coastal & deltaic regions | Moderate increase | Moderate increase | Mixed | Strong increase | Strong, mixed | Weak increase |
- Strong increase
- Moderate increase
- Weak increase
- Strong but mixed
- Mixed or uncertain
- Decrease
- Little change
5. City-Level Case Studies
Cities concentrate people and concentrate breeding sites. The examples below use real places and real published patterns; the “climate pressure” and “lever” lines are the author’s synthesis.
5.1 Urban mechanisms that cut across every city
- Urban heat island (UHI). Dense built-up areas retain heat and cool slowly at night. Warmer nights speed larval development and shorten the EIP. The effect is mixed in very hot cities, where midday surface heat can also exceed mosquito tolerance.
- Impervious surfaces and blocked drains. Concrete sheds rain quickly into drains; if drains are clogged with waste, they hold water instead of removing it.
- Discarded containers and tyres. Small, shaded, rain-catching, nutrient-rich: ideal Aedes habitat.
- Air-conditioner drip trays, plant saucers, roof gutters. Warm, sheltered and constantly refilled.
- Construction sites. Excavations, foundations and stored materials hold water for weeks.
- Rooftop tanks and unmanaged storage. Uncovered tanks, cisterns and drums, common where supply is intermittent.
- Poor waste collection and informal settlements. Water storage in drums, weak drainage and limited screening raise both breeding and exposure.
- Cooler and drier cores. Urban centres can also be drier than surroundings (little vegetation, fast runoff) and, in some cities, cooler by day than irrigated peri-urban land, so risk can be lower in the core and higher at the margins. Vegetation can help or hurt: a 2026 preprint from Montpellier reported higher Ae. albopictus survival in vegetated urban spaces, a caution for greening schemes that ignore water and shade management.
- Rooftop water tanks. Uncovered tanks hold water for weeks; Aedes and urban An. stephensi. Intermittent supply raises storage.
- Blocked storm drains and nullahs. Heavy rain that cannot drain leaves organically rich pools: Culex.
- Construction pits and site water. Excavations and stored materials hold rainwater for weeks; suits An. stephensi and Aedes.
- Discarded tyres and containers. Small, shaded and rain-filled: ideal Aedes habitat.
- AC drip trays, plant saucers, gutters. Warm, sheltered and refilled daily, even in dry weather.
- Flooded low-lying settlements. Stagnant flood water plus drums for stored water; Culex, Aedes, and limited screening raise exposure.
- Coastal tidal zones and marsh. Sea-level rise and storm surge create brackish pools favouring salt-tolerant species.
- Urban heat island. Built-up cores stay warm at night, speeding larval development and shortening the pathogen’s incubation. In very hot cores it can instead push temperatures past the optimum.
- Open drains and septic overflow. Nutrient-rich, polluted water; classic Culex quinquefasciatus habitat.
5.2 Mumbai, India
Regime: tropical monsoon, with the large majority of annual rain falling between June and September.
Vectors: Ae. aegypti (dengue, chikungunya), Culex (filariasis, nuisance) and urban An. stephensi (malaria).
Breeding sites: rooftop and ground-level water tanks, under-ground septic tanks, construction pits, discarded containers and tyres, blocked drains, clogged gutters and nullahs, AC outdoor units, and low-lying informal settlements where water is stored in drums. Tidal flooding and extreme rainfall can leave standing water across large areas.
Climate pressure: intense monsoon bursts, longer warm periods around the monsoon shoulders, and intensifying extremes such as the July 2005 deluge.
Lever: enforceable, routine source reduction on construction sites and tanks, combined with drainage maintenance timed before the monsoon; the lag between rain and vector peaks (roughly 2–6 weeks in many monsoon settings) makes pre-monsoon action valuable.
5.3 Singapore
Regime: equatorial, warm and wet all year.
Vector: Ae. aegypti in dense high-rise estates.
Singapore shows that a hot, humid, dense city can still keep dengue in check through intensive surveillance, source reduction and law enforcement, yet it also shows the limits: cases reached a record 35,315 in 2020 and 32,000+ in 2022 before falling to 9,949 in 2023, 13,651 in 2024 and about 4,000 in 2025 (NEA data as reported). Such swings reflect serotype shifts, population immunity and behaviour as well as mosquito control.
Wolbachia programme: the National Environment Agency releases male Aedes carrying the bacterium Wolbachia to suppress Ae. aegypti populations. A multi-site field study (2022–2024), published in the New England Journal of Medicine, showed a large fall in Ae. aegypti numbers and more than 70% reduction in dengue risk among residents of release areas; coverage is being expanded towards about half of households by end-2026 (NEA).
Lever: sustain and extend suppression while keeping conventional source reduction.
5.4 São Paulo, Brazil
Regime: humid subtropical, with wet summers.
Vector: Ae. aegypti.
Pattern: drought-driven water storage alongside intense summer rain. During the 2014–15 water crisis many households stored water, and São Paulo state then had a very large dengue season in 2015; researchers have discussed storage as a plausible contributor. Brazil recorded 3.1 million dengue cases in 2023 (Haider et al. 2024).
Climate pressure: the swing between drought and downpour.
Lever: reliable piped water (reducing the need for storage) and rapid drainage of after-rain standing water.
5.5 Miami and South Florida, USA
Regime: subtropical, coastal and low-lying.
Vectors: Ae. aegypti, Ae. albopictus and salt-marsh species.
Pattern: local transmission of dengue has recurred in Florida for years, and in 2016 Miami-Dade saw the first local Zika transmission in the continental United States. Sea-level rise and “sunny-day” flooding push brackish water inland.
Climate pressure: heat, heavy rain, and sea-level rise.
Lever: well-resourced integrated mosquito management, drainage upgrades, and early detection of imported cases.
5.6 Nairobi and the East African highlands
Regime: tropical highland, cool because of altitude (Nairobi sits around 1,700 m).
Vectors: the An. gambiae complex and An. funestus are the main malaria vectors across East Africa; An. stephensi has been detected in Kenya since 2022.
Pattern: the altitude-limited frontier. Warming, plus the vector’s urban adaptation, could extend risk into populations with low immunity. The 2025 WHO malaria report, as covered by Reuters, singled out Ethiopia, Madagascar and Yemen for jumps in cases in 2024; WHO lists drug and insecticide resistance, climate change and conflict among the factors challenging control, so climate is one driver among several.
Lever: highland-specific early warning, surveillance of urban An. stephensi, and fast case management.
5.7 Rome, Paris and Barcelona
Regime: Mediterranean and temperate.
Vector: Ae. albopictus, established across southern Europe and moving north.
Pattern: repeated locally acquired dengue and chikungunya events, typically from late summer to autumn, seeded by infected travellers.
Climate pressure: longer, warmer summers and milder winters.
Lever: surveillance at ports and tyre depots, rapid response around imported cases, and public awareness of container hygiene at home.
6. Data Tables
How to read these tables. [Observed] = measured trend; [Model] = model projection; [Inference] = author’s synthesis. Confidence ratings in Table 2 are the author’s qualitative assessments based on the cited literature, not published scores. Thermal ranges are model-derived and vary by pathogen, strain and method.
Table 1: Species vs. climatic tolerance
| Species | Typical breeding habitat | Transmission optimum / range (°C) | Humidity & rainfall sensitivity | Main diseases | Source |
|---|---|---|---|---|---|
| Aedes aegypti | Small artificial containers, water storage, tyres, gutters near homes | Optimum ~26–29 (dengue/Zika/chik); range ~18–34 (Zika: 22.7–34.7; 29 optimum) | Eggs survive drying; rain refills containers; drought raises household storage | Dengue, chikungunya, Zika, yellow fever | Mordecai 2017; Tesla 2018 |
| Aedes albopictus | Artificial and natural containers (tree holes, bamboo) | Cooler optimum than Ae. aegypti; range treated as suitable ~19.9–29.4 in one global study | Diapausing eggs enable winter survival in temperate climates | Dengue, chikungunya, Zika | Ryan 2019 |
| Anopheles gambiae | Sunlit, shallow temporary pools, puddles | Optimum ~25; limits differ between species | Rain creates pools; sensitive to dry-season drying | Malaria (P. falciparum) | Mordecai 2013; Villena 2022 |
| Anopheles stephensi | Urban containers, overhead tanks, wells, construction sites | Optimum similar (~mid-20s); upper and lower limits differ from An. gambiae | Persists in dry seasons via stored water | Malaria (P. falciparum, P. vivax) | Villena 2022; Sinka 2020 |
| Culex quinquefasciatus / pipiens | Polluted, organic-rich water: drains, septic tanks, ponds | West Nile transmission peaks ~23–26 | Thrives with stagnation and organic load; drought concentrating pools can raise risk | West Nile virus, lymphatic filariasis | Shocket 2020 |
| Culex tritaeniorhynchus | Flooded rice fields, irrigation | Not specified here | Tied to irrigation and monsoon flooding | Japanese encephalitis | General entomological literature |
Table 2: Climate driver to breeding-ground effect
| Driver | Mechanism | Expected effect on breeding/transmission | Confidence [Inference] | Regions most affected |
|---|---|---|---|---|
| Warmer mean temperature | Faster development, shorter EIP, more biting, until upper limits | Increase in cool zones; mixed near optimum; decrease >~34 °C | High (physiology); medium (local) | Highlands, temperate zones; hottest lowlands mixed |
| Warmer nights | Cold nights no longer limit survival and development | Increase | Medium–high | Highlands, temperate regions, urban cores |
| Heavier downpours | Fill containers and drains; can flush larvae | Mostly increase, with lag and short-term dips | Medium | Monsoon Asia, tropical cities |
| Longer dry spells | Household water storage; isolated river pools | Mixed | Medium–low | Semi-arid, cities with unreliable supply |
| Flooding | Creates temporary pools; leaves stagnant water | Increase (esp. Culex, Anopheles) | Medium | Deltas, low-lying cities |
| Humidity change | Adult survival and host-seeking | Mixed | Low–medium | Semi-arid, continental interiors |
| Sea-level rise, salinity | Brackish pools; species turnover | Mixed | Low–medium | Deltas, coastal cities |
| ENSO variability | Regional rain/temperature anomalies | Epidemic-year increases | Medium | Americas, Southeast Asia, East Africa |
| Milder winters | Higher overwintering survival; earlier start | Increase | Medium–high | Temperate zones |
Table 3: City comparison
| City | Climate type | Main vectors | Key breeding sites | Seasonal peak | Main climate pressure | Priority intervention |
|---|---|---|---|---|---|---|
| Mumbai | Tropical monsoon | Ae. aegypti, Culex, An. stephensi | Rooftop tanks, construction pits, drains, informal-settlement storage | Monsoon and post-monsoon | Extreme rain, tidal flooding | Pre-monsoon source reduction and drain maintenance |
| Singapore | Equatorial | Ae. aegypti | Household containers, gutters, construction sites | Year-round; varies by year | Warm, wet, dense city | Surveillance, enforcement, Wolbachia |
| São Paulo | Humid subtropical | Ae. aegypti | Stored water, containers | Summer to early autumn | Drought–downpour swings | Reliable water supply, drainage |
| Miami | Subtropical coastal | Ae. aegypti, Ae. albopictus, salt-marsh species | Containers, flooded low ground | Warm, wet season | Sea-level rise, heat | Integrated mosquito management |
| Nairobi / highlands | Tropical highland | Anopheles complex; An. stephensi emerging | Pools, urban containers | After rains (lagged) | Warming at altitude | Early warning, urban vector surveillance |
| Rome / Paris / Barcelona | Mediterranean / temperate | Ae. albopictus | Containers, tyres, courtyards | Late summer to autumn | Longer summers, milder winters | Port/tyre surveillance, rapid response |
Table 4: Projections
Important: published projections use different scenario sets, time periods and models, so they cannot be merged into one clean scenario-by-decade grid without inventing numbers. The tables below give what the sources actually report and label the scenario as the source defines it. The study by Colón-González et al. (2021) used six combinations of emission (RCP) and socioeconomic (SSP) scenarios; its reported bounds are the lowest-emission and highest-emission cases.
4a. Population at risk (global), Colón-González et al. 2021, Lancet Planetary Health [Model]
| Disease | Baseline 1970–99 | Lowest-emission scenario (~1 °C warming 2081–2100), 2070–99 | Highest-emission scenario (~3.7 °C by 2100), 2070–99 |
|---|---|---|---|
| Malaria | 3.7 billion (75.6% of population) | +2.35 billion (about 6.05 billion; derived) | 8.4 billion (89.3% of a projected 9.4 billion); +4.7 billion |
| Dengue | 3.8 billion | +2.41 billion (about 6.21 billion; derived) | 8.5 billion |
Figures combine climate and population growth. The study did not include socioeconomic adaptation, vector or parasite evolution, or new drugs and vaccines.
4b. Other published projections and observed trends
| Item | Finding | Type | Source |
|---|---|---|---|
| Transmission potential, dengue, Ae. albopictus | +48.5% (1951–60 vs 2015–24, climate-defined) | [Observed/modelled] | Lancet Countdown (2025 data) |
| Transmission potential, dengue, Ae. aegypti | +17.0% (same period) | [Observed/modelled] | Lancet Countdown (2025 data) |
| Malaria climate suitability, highland areas | +13.9% (P. falciparum), +13.0% (P. vivax), 1951–60 vs 2015–24 | [Observed/modelled] | Lancet Countdown (2025 data) |
| Malaria, tropical highlands >1,000 m, highest emissions | Up to +1.6 suitable months, 2070–99 vs 1970–99 | [Model] | Colón-González 2021 |
| Dengue season, tropical lowlands (SE Asia, sub-Saharan Africa, Indian subcontinent), highest emissions | Up to +4 months | [Model] | Colón-González 2021 |
| Newly exposed to Aedes-borne virus transmission, worst case, within the century | Nearly 1 billion people | [Model] | Ryan 2019 |
| Ae. albopictus suitability, SE Asia and West Africa | Significant reductions (too hot) | [Model] | Ryan 2019 |
| Europe, Aedes-borne risk | Substantial increase even in the short term | [Model] | Ryan 2019 |
| Ae. albopictus northward establishment in Europe | ~60 km per year by 2025 (95% CI ~40–81) | [Observed/estimated] | Lancet Planetary Health 2025 |
7. Uncertainties and Counter-Trends
- Warming is not uniformly bad. Above roughly 34 °C, transmission by the main vectors falls in models, and the worst-case scenarios in one major study made some areas too hot for some mosquito species. That is no comfort: the same heat drives heat-related deaths, lower labour productivity and food-production losses.
- Some suitability metrics show declines. The 2025 Lancet Countdown report on small island developing states (SIDS) noted a 5% decrease in months suitable for malaria transmission in its low-elevation countries, even as dengue and chikungunya suitability rose.
- Human adaptation dominates in many places. Screened housing, piped water, air conditioning and reliable drainage reduce contact. Malaria has retreated from many temperate regions largely for these reasons, not climatic ones.
- Models leave things out. Land use, migration, insecticide resistance, immunity, serotype cycles and vector-control funding all sit outside pure climate-driven models, and the authors of the main global study acknowledge this.
- Observed surges are not proof of causation. The record 2023–24 dengue years coincided with a strong El Niño and warm temperatures, but also with immunity shifts and reporting changes.
8. Adaptation and Mitigation
- Source reduction and integrated vector management (IVM). Removing or covering breeding sites, larviciding where needed and community participation remain the backbone. In monsoon cities, timing matters more than quantity: act before the rains.
- Water and drainage infrastructure. Reliable piped water reduces storage; well-maintained drains and solid-waste collection remove habitat.
- Climate-informed early-warning systems. Rainfall and temperature forecasts, combined with the known lags (weeks) between weather and cases, can trigger action before peaks. Seasonal forecasts linked to ENSO are especially useful in the Americas and East Africa.
- Wolbachia and sterile or incompatible-insect techniques. Singapore's experience and other field trials show large reductions in Aedes populations and dengue where deployment is sustained; results vary by site and year.
- Urban design. Cool roofs and greening can reduce heat, but must be designed to avoid creating new water-holding niches and shaded refuges.
- Surveillance for invasive vectors. Early detection of An. stephensi in African cities and Ae. albopictus at European ports.
- Emissions reduction. The low-emission scenario in Colón-González et al. (2021) is the clearest illustration: the increase in population at risk is roughly halved compared with the highest-emission case.
9. Conclusion
Climate change does not create mosquito-borne disease from nothing. It shifts the boundaries of an existing system: it lengthens seasons, pushes suitability up mountains and towards the poles, intensifies risk in already-endemic cities, and, in the very hottest places, may lower it. Rainfall, storage, drainage, waste and housing decide whether a given climate becomes a given outbreak, which is why the same weather produces very different outcomes in Mumbai, Singapore and São Paulo.
The evidence supports concern but not fatalism. Projections consistently show more people living in climatically suitable areas, yet they also show that emissions choices, surveillance and infrastructure change the outcome. The most useful step for a city today is unglamorous and specific: know where water collects, remove it before the peak season, and use forecasts to act early.
10. Sources & Further Reading
Every figure in this article traces to one of the sources below. Where a source is a web page rather than a paper, that is stated. Please check the original before quoting a number.
Disease burden
- WHO. World Malaria Report 2025 (December 2025). 282 million cases and 610,000 deaths in 2024.
- Haider N, Hasan MN, Onyango J, Asaduzzaman M. Global landmark: 2023 marks the worst year for dengue cases with millions infected and thousands of deaths reported. IJID Regions 2024; 13:100459.
- Haider N, et al. Global dengue epidemic worsens with record 14 million cases and 9,000 deaths reported in 2024. International Journal of Infectious Diseases 2025; 158:107940.
- Bhatt S, et al. The global distribution and burden of dengue. Nature 2013; 496:504–507.
Temperature, thermal biology and EIP
- Mordecai EA, et al. Detecting the impact of temperature on transmission of Zika, dengue, and chikungunya using mechanistic models. PLoS Neglected Tropical Diseases 2017; 11(4):e0005568.
- Mordecai EA, et al. Optimal temperature for malaria transmission is dramatically lower than previously predicted. Ecology Letters 2013; 16:22–30.
- Mordecai EA, et al. Thermal biology of mosquito-borne disease. Ecology Letters 2019; 22:1690–1708.
- Tesla B, et al. Temperature drives Zika virus transmission: evidence from empirical and mathematical models. Proceedings of the Royal Society B 2018; 285:20180795.
- Villena OC, et al. Temperature impacts the environmental suitability for malaria transmission by Anopheles gambiae and Anopheles stephensi. Ecology 2022; 103(8):e3685.
- Shocket MS, et al. Transmission of West Nile and five other temperate mosquito-borne viruses peaks at temperatures between 23 °C and 26 °C. eLife 2020.
- Chan M, Johansson MA. The incubation periods of dengue viruses. PLoS ONE 2012; 7(11):e50972.
- Lambrechts L, et al. Impact of daily temperature fluctuations on dengue virus transmission by Aedes aegypti. PNAS 2011.
- Paaijmans KP, et al. Influence of climate on malaria transmission depends on daily temperature variation. PNAS 2010.
Drivers, geography and case studies
- Johansson MA, Cummings DAT, Glass GE. Multiyear climate variability and dengue: El Niño Southern Oscillation, weather, and dengue incidence in Puerto Rico, Mexico, and Thailand. PLoS Medicine 2009.
- Linthicum KJ, et al. Climate and satellite indicators to forecast Rift Valley fever epidemics in Kenya. Science 1999.
- Siraj AS, et al. Altitudinal changes in malaria incidence in highlands of Ethiopia and Colombia. Science 2014; 343:1154–1158.
- Ramasamy R, et al. Larval development of Aedes aegypti and Aedes albopictus in peri-urban brackish water and its implications for transmission of arboviral diseases. PLoS Neglected Tropical Diseases 2011.
- Sinka ME, et al. A new malaria vector in Africa: predicting the expansion range of Anopheles stephensi and identifying the urban populations at risk. PNAS 2020; 117:24900–24908.
- Northward expansion of Aedes albopictus-associated arbovirus transmission risk in Europe. The Lancet Planetary Health, correspondence, November 2025.
- Singapore National Environment Agency, Project Wolbachia updates and dengue statistics (web pages, 2023–2026), including the multi-site field study reported in the New England Journal of Medicine.
Projections and monitoring
- Colón-González FJ, et al. Projecting the risk of mosquito-borne diseases in a warmer and more populated world: a multi-model, multi-scenario intercomparison modelling study. The Lancet Planetary Health 2021; 5(7):e404–e414. doi:10.1016/S2542-5196(21)00132-7.
- Ryan SJ, Carlson CJ, Mordecai EA, Johnson LR. Global expansion and redistribution of Aedes-borne virus transmission risk with climate change. PLoS Neglected Tropical Diseases 2019; 13(3):e0007213.
- Lancet Countdown on Health and Climate Change: data explorer and annual reports (2025 data cited).
- Kraemer MUG, et al. The global distribution of the arbovirus vectors Aedes aegypti and Ae. albopictus. eLife 2015; 4:e08347.
- ECDC. Local transmission of dengue and chikungunya in mainland EU/EEA (surveillance pages, updated annually).
Editorial Team & Contributors

Raashid Ansari, Founder, Content Researcher & Author - MosquiTalk
Not an entomologist — just a genuinely curious writer who started researching mosquitoes and couldn't stop. What began as casual reading about repellents and bite prevention gradually turned into a deep ongoing dive into vector biology, disease epidemiology, animal health impacts, and the real science behind mosquito control. Everything published here is carefully edited, and written with one purpose: giving readers accurate, accessible information they can actually trust and use to protect themselves, their families, and their pets, birds and cattle.
Active across social platforms, regularly publishes, and genuinely invested in spreading mosquito awareness where it matters most. Because informed readers make better decisions — and better decisions save lives.