A Deep-Dive Into Seasonal Timing, Geographic Zones, State-by-State Patterns, Year-Over-Year Shifts, and How the Season Evolves Across the United States
Table of Contents
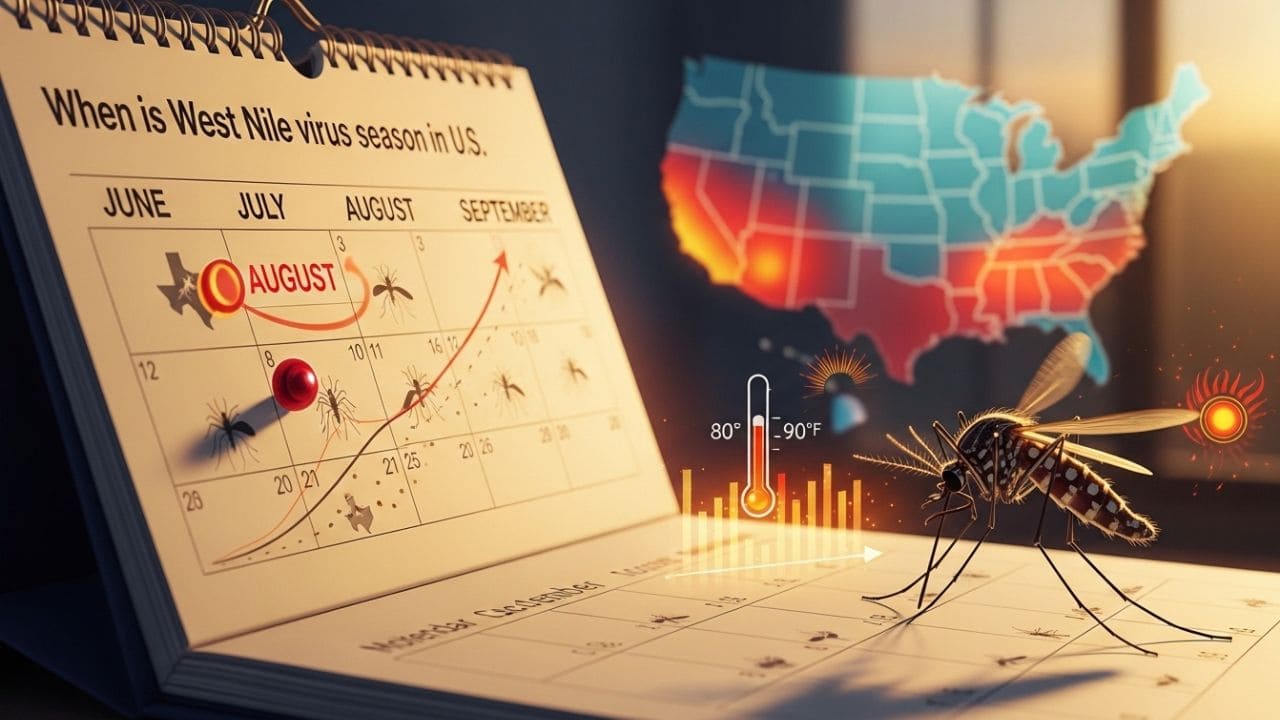
Introduction to West Nile Virus Season Across the United States
Every summer in the United States, a biological clock ticks quietly in the background. Mosquitoes emerge. Birds migrate. Temperatures climb. And somewhere — in a backyard in Texas, a wetland in California, a suburb outside Chicago — a mosquito picks up a virus from an infected bird and the West Nile Virus season begins again.
It happens every single year. Without fail.
But the season isn’t the same everywhere. It doesn’t start on the same date across every state. It doesn’t peak at the same time in Louisiana as it does in Minnesota. It doesn’t end in Arizona the way it ends in New York. West Nile Virus season in the US is a moving, shifting, geographic event — and understanding exactly when and where it unfolds is genuinely useful information if you live in this country.
This article goes deep into the timing of West Nile Virus season. Not just when it starts and ends, but how the season progresses across different climate zones, which states carry the heaviest burden and when, how the season has changed year over year, and what drives those changes. The goal is to give you a clear, detailed, geography-focused picture of this annual public health event.
West Nile Virus Season in the US: The National-Level Timeline
At the broadest level, West Nile Virus season in the continental United States runs from approximately May through October. That’s the window during which Culex mosquitoes — the primary vectors of WNV — are active enough to sustain virus transmission between birds and humans.
But within that five-to-six-month window, the season has a very specific rhythm. It doesn’t arrive all at once. It builds. It peaks. It fades. And it does all of that on a schedule that public health officials have now tracked closely for over 25 years, since the virus first appeared on US soil in 1999.
Here’s how the national WNV season typically unfolds:
| Month | Phase | Mosquito Activity | Bird-Mosquito Cycle | Human Risk |
| May | Emergence | Low — first adults appear | Begins in southern states | Minimal |
| June | Buildup | Moderate — populations growing | Active in South, starting in Midwest | Low–Moderate |
| July | Escalation | High — broad geographic spread | Intense cycle; virus amplifying in bird populations | Moderate–High |
| August | PEAK | Very High — nationwide | Maximum amplification in all regions | PEAK NATIONALLY |
| September | Decline begins | High in South, dropping in North | Cycle slowing as birds develop immunity | High in South/SW |
| October | Winding down | Low in North, moderate in South | Largely over except in Gulf states | Low–Moderate in South |
| Nov–Apr | Dormant | Essentially none | Virus overwinters in some hosts | Negligible |
The critical thing to understand about this table is that it represents national averages. The actual start date, peak timing, and end date vary enormously by region. In southern states, that May emergence can be earlier — sometimes April. In northern states, August might be the only truly high-risk month before temperatures drop. That geographic variation is where the real story of WNV season lives.
West Nile Virus monthly national risk levels from January through December, peaking in August
Monthly West Nile Virus Transmission Risk — National Average
West Nile Virus Season by US Climate Zone: When Each Region’s Season Actually Starts
The United States spans multiple distinct climate zones, and West Nile Virus season behaves very differently in each of them. Understanding the zone your state falls into is the most practical way to know when your personal risk window actually opens — and when it closes.
Below is a breakdown of WNV season timing across the five primary US climate zones where transmission regularly occurs.
Zone 1: The Gulf Coast and Deep South (Florida, Louisiana, Mississippi, Alabama, Georgia, South Carolina, coastal Texas)
This is the earliest-starting, longest-running WNV zone in the country. The combination of subtropical heat, high humidity, and year-round water availability means mosquito populations never fully collapse the way they do further north.
Season start: Late March to mid-April in most years. Some years, particularly after warm winters, the first mosquito activity begins in February in southern Florida.
Peak: June through August, though meaningful transmission can persist well into October and even November in south Florida.
Season end: December in extreme southern areas. October–November for the rest of the zone.
Total season length: 7 to 9 months — the longest of any US zone.
What makes this zone different is that it never fully resets. The virus doesn’t have to start from scratch each spring the way it does in northern states. Culex quinquefasciatus — the southern house mosquito — can remain active year-round in the warmest parts of this zone, meaning the potential for low-level WNV transmission exists even in winter months, though documented human cases in December and January are rare.
Florida is a unique case. Miami-Dade, Broward, and Palm Beach counties have documented WNV activity in 11 out of 12 calendar months in certain years. The “season” there is almost a misnomer — it’s closer to a persistent, fluctuating level of background transmission.
Zone 2: The Southwest Desert Zone (Arizona, New Mexico, Nevada, inland Southern California)
The Southwest presents a paradox. These are dry, often intensely hot states where you wouldn’t expect prolific mosquito activity. But West Nile Virus thrives here, and has for years, because of one key factor: irrigation.
Arizona’s canal system, New Mexico’s agricultural irrigation infrastructure, Nevada’s urban storm drain networks, and California’s vast Central Valley irrigation systems all create massive, stable bodies of standing water that Culex mosquitoes exploit completely.
Season start: April in low-elevation desert areas (Phoenix, Las Vegas, El Paso). May in higher-elevation inland areas.
Peak: July through September. The monsoon season, which typically arrives in Arizona and New Mexico in July, creates additional standing water and can dramatically spike mosquito populations within days.
Season end: October or early November, depending on when the first sustained cooler nights arrive.
Total season length: 6 to 7 months.
Arizona has been one of the most consistently active WNV states since 2003. Maricopa County (Phoenix metropolitan area) regularly ranks among the top five counties in the nation for WNV neuroinvasive disease cases — a sobering statistic for a desert region. The combination of year-round warm weather, massive irrigation networks, and dense suburban development near water infrastructure creates near-ideal conditions for Culex tarsalis and Culex quinquefasciatus, the two dominant vectors in this zone.
Zone 3: The Southern Plains and Transition Zone (Texas, Oklahoma, Kansas, Missouri, Arkansas, Tennessee, North Carolina)
This zone covers a wide swath of central and south-central America where the climate transitions from subtropical in the south to temperate in the north. WNV season timing shifts noticeably as you move north through this zone.
Season start: April in south Texas and coastal areas. May in the central and northern parts of the zone (Kansas City, Nashville, Charlotte).
Peak: July and August — almost universally the worst months across this entire zone.
Season end: October across most of the zone. Lingering activity into November in south Texas.
Total season length: 6 months in the north to 7+ months in the south.
Texas deserves its own importance here. The state is simply in a category of its own when it comes to WNV burden. Dallas County alone recorded over 400 human cases in the 2012 outbreak — one of the largest single-county WNV events in US history.
Harris County (Houston), Tarrant County (Fort Worth), and Bexar County (San Antonio) are perennial hotspots. The Dallas–Fort Worth Metroplex sits at an unfortunate geographic intersection of active bird migration corridors, warm summers, and suburban water features, making it one of the most WNV-active metropolitan areas in the country year after year.
Oklahoma and Kansas see aggressive but shorter seasons — the virus arrives in June, peaks hard in August, and largely disappears by late September when Great Plains temperatures drop.
Zone 4: The Midwest and Great Lakes (Illinois, Indiana, Ohio, Michigan, Wisconsin, Minnesota, Iowa, Nebraska, South Dakota, North Dakota)
This is a zone of compressed intensity. The WNV season is shorter here than in the South or Southwest, but what it lacks in length it can make up for in severity within its limited window.
Season start: Late May to June. Illinois, Indiana, and Ohio consistently see earlier activity than Wisconsin or Minnesota, where meaningful mosquito emergence may not begin until mid-June.
Peak: August — almost exclusively. The entire transmission season in the northern Midwest essentially converges on a single peak month.
Season end: September in the northernmost states (Minnesota, Wisconsin, North Dakota). October in Illinois, Indiana, and Ohio.
Total season length: 3 to 5 months depending on how far north you go.
Illinois has been one of the most consistently high-reporting Midwest states. Cook County (Chicago) and surrounding collar counties report WNV cases nearly every year, driven by the combination of dense bird migration along the Mississippi Flyway — one of the four major bird migration routes in North America — and extensive urban green spaces and waterways where Culex pipiens thrives.
Nebraska and South Dakota are interesting outliers in this zone. Despite being Northern Plains states with cold winters, they consistently rank among the highest states for WNV cases per capita. The reason is largely agricultural — irrigation-heavy cropland creates extensive standing water habitat that produces enormous Culex tarsalis populations during the summer months. The season is short but brutal.
South Dakota held the grim record for the highest per-capita WNV neuroinvasive disease rate in the US in multiple years. It’s a stark reminder that cold winters don’t mean low annual risk — what matters is what happens during the summer window.
Zone 5: The Pacific Coast and Mountain West (California, Oregon, Washington, Colorado, Utah, Idaho, Montana, Wyoming)
This zone is highly variable because it encompasses everything from coastal California’s Mediterranean climate to Colorado’s high plains to the Pacific Northwest’s cool, wet forests. WNV behavior differs substantially between the different parts of this zone.
California’s Central Valley: Season starts in April-May, peaks in August-September, ends in October. The Central Valley is one of the most WNV-active regions in the country. Fresno, Sacramento, Kern, and Tulare counties routinely report high case counts. The valley’s flat topography, extensive agricultural irrigation, and reliable summer heat create textbook Culex tarsalis habitat.
Southern California: Season start April-May, peak July-September, end October-November. San Bernardino and Riverside counties carry a heavy annual burden. LA County has seen significant outbreaks, though urban density and active vector control programs moderate the numbers somewhat.
Northern California and coastal areas: Shorter season, lower intensity. The cool Pacific influence keeps temperatures more moderate, which suppresses but doesn’t eliminate mosquito activity.
Colorado: One of the most surprising WNV states in the country. Denver and the Front Range have seen consistent, significant case counts since 2003. The season runs May through September, with a sharp August peak. Colorado’s semi-arid climate might suggest low mosquito risk, but Front Range irrigation and the South Platte River corridor create significant Culex habitat in proximity to dense suburban and urban populations.
Pacific Northwest (Oregon, Washington): Low WNV transmission overall. The cool, wet climate is not ideal for Culex quinquefasciatus, though Culex tarsalis is present in eastern Oregon and Washington where the climate is drier and warmer. Seasons are short — June to September — and case counts are generally low compared to other regions.
Montana, Idaho, Wyoming: WNV activity is present but limited. Rural, low-population states with variable but generally short seasons. Some years see notable activity; many pass without significant reported cases.
West Nile Virus Season: State-by-State Breakdown of Timing and Annual Burden
The following breakdown covers the states that consistently report the most WNV activity. Season dates listed reflect typical years based on CDC ArboNET surveillance data from 1999–2023. Actual timing in any given year can shift by 2–4 weeks depending on weather conditions.
| State | Season Start | Peak Month(s) | Season End | Notes on Seasonal Pattern |
| Texas | April | July–Aug | Nov | Longest active season outside Florida; DFW metro is a national hotspot; south TX can see activity into December |
| California | April–May | Aug–Sep | Oct–Nov | Central Valley is most active; coastal areas shorter/lower; LA Basin sees annual cases |
| Arizona | April | July–Sep | Oct–Nov | Monsoon season (July) causes sharp mid-season spike; Maricopa County perennially top-5 nationwide |
| Colorado | May | August | Sep–Oct | Front Range irrigation corridor drives Denver/Suburban cases; per-capita rates often among highest nationally |
| Florida | Mar–Apr | June–Aug | Nov–Dec | Quasi-perennial in extreme south; panhandle behaves more like Deep South typical pattern |
| Louisiana | April | July–Aug | Oct–Nov | High humidity + warm temps + wetlands = persistent risk; New Orleans metro historically active |
| Illinois | May–June | August | Sep–Oct | Mississippi Flyway bird corridor amplifies risk; Chicago suburbs consistent annual cases |
| Nebraska | May | August | September | Irrigation agriculture drives outsized case counts; very short but intense season |
| South Dakota | June | August | September | Highest per-capita neuroinvasive rates in multiple years; intense but brief season |
| Mississippi | April | July–Aug | Oct | Delta region and agricultural flatlands create extensive mosquito habitat |
| Oklahoma | May | July–Aug | October | Mirrors Texas pattern but shorter; Tulsa and OKC metro see consistent activity |
| Kansas | May | August | September | Wichita and Kansas City suburbs see most cases; agricultural areas in west also active |
| Michigan | June | August | September | Lower Peninsula more active than Upper; Great Lakes influence moderates but doesn’t eliminate risk |
| Minnesota | June | August | September | Short but real season; Minneapolis metro sees most cases; rural agricultural areas also active |
| Ohio | May–June | August | September–Oct | Multiple river corridors drive activity; Columbus, Cincinnati, and Cleveland metros all report cases annually |
| Georgia | April | July–Aug | October | Atlanta suburbs see consistent activity; coastal plain areas have longer seasons |
| North Carolina | May | July–Aug | October | Eastern NC (coastal plain) more active than western mountains; Research Triangle sees annual cases |
| New Mexico | May | July–Sep | October | Monsoon spike mirrors Arizona; Rio Grande corridor is primary transmission corridor |
| Nevada | April–May | July–Sep | October | Las Vegas valley drainage systems create urban mosquito habitat; rural NV sees Culex tarsalis activity |
| Missouri | May | August | September–Oct | Kansas City and St. Louis metros; Missouri River floodplain agricultural areas |
| Arkansas | April–May | July–Aug | October | Delta lowlands (Mississippi River plain) most active; lower WNV media attention than burden warrants |
| Indiana | May–June | August | September | Suburban Indianapolis and agricultural northern counties see most cases |
| Iowa | May–June | August | September | Corn Belt agriculture + Des Moines River corridor; overlooked WNV state |
| Wisconsin | June | August | September | Milwaukee metro and agricultural central WI; Madison lakes area sees activity |
| New York | June | Aug–Sep | October | Downstate (NYC suburbs, Long Island) historically more active; site of original 1999 US outbreak |
| New Jersey | June | Aug–Sep | October | Dense suburban development + coastal wetlands; consistently active season |
| Pennsylvania | June | August | September–Oct | Southeastern PA (Philadelphia suburbs) most active; western PA lower risk |
| Oregon | June | August | September | Eastern Oregon (drier, warmer) more active than coast; overall lower risk than most Western states |
| Washington | June–July | August | September | Eastern WA more active; Puget Sound region low risk; season very compressed |
| Utah | May | Aug | September | Wasatch Front (SLC metro) sees most cases; irrigation in agricultural valleys creates habitat |
| Idaho | June | August | September | Snake River Plain agriculture drives cases; short but real season in southern ID |
A few observations from the data above:
Texas, California, Arizona, and Colorado are the four states that appear most consistently at the top of WNV case counts. But on a per-capita basis, South Dakota, Nebraska, and North Dakota routinely outrank the larger-population states. That per-capita measure is arguably more meaningful for understanding true transmission intensity — it tells you how likely any given resident is to be exposed, regardless of total population.
US choropleth map shading states by West Nile Virus burden level, with Texas, California, Arizona and Colorado shown as highest risk
West Nile Virus annual burden by state — relative risk level
Based on cumulative CDC ArboNET case data and per-capita rates 1999–2023. Hover a state for details.
Dual bar chart comparing total West Nile Virus cases versus per-capita rates for the top 12 US states, showing how South Dakota and Nebraska rank higher per capita despite lower total cases
Top States by WNV Burden — Total Cases vs Per-capita Rate
Per-capita figures represent approximate average annual rates based on CDC ArboNET cumulative data 1999–2023 divided by state population. Toggle to compare both views.
States at Highest Risk for West Nile Virus Outbreaks
West Nile Virus has been reported in all 48 contiguous states, but some regions consistently carry a heavier burden. According to CDC ArboNET surveillance data, the following states report the highest annual case counts:
- Texas — Historically the hardest-hit state; Dallas County alone experienced a major outbreak in 2012
- California — Large population + warm climate + agricultural areas with standing water = persistent risk
- Arizona — Hot, dry conditions seem counterintuitive, but irrigation canals create ideal mosquito habitat
- Colorado — Surprisingly high risk; Denver and surrounding counties see consistent annual cases
- Nebraska and South Dakota — Northern Plains states see intense but shorter seasons
- Louisiana and Mississippi — Gulf Coast humidity and heat extend the season well into fall
- Illinois and Ohio — Midwest cases concentrated in urban and suburban counties
Urban and suburban areas near rivers, lakes, and wetlands tend to see the most cases. Rural areas aren’t immune, though — irrigation-heavy agricultural regions can harbor massive mosquito populations.
The Four Flyways: How Bird Migration Routes Shape West Nile Virus Season Across States
One of the most underappreciated factors in understanding when and where WNV season is most intense is bird migration. West Nile Virus is primarily amplified in birds — they’re the reservoir hosts that allow the virus to multiply and then get picked up by feeding mosquitoes. And birds don’t stay put. They travel along four major continental migration corridors called flyways, and those flyways essentially map onto the regions of highest WNV transmission in the US.
The Pacific Flyway
Runs along the West Coast and through the Pacific Mountain states. This flyway carries birds through California, Oregon, Washington, Nevada, and parts of Idaho and Montana. California’s consistently high WNV burden is partly a function of being positioned directly on this heavily trafficked corridor — millions of birds pass through the Central Valley every spring and fall, and the virus travels with them.
The Pacific Flyway also explains why Central Valley WNV activity often spikes earlier in the season than you’d expect — infected birds are arriving from the south and southwest, seeding the virus into local mosquito populations before the height of summer heat arrives.
The Central Flyway
This is the most WNV-significant flyway in the US. It runs through the heart of the country — from the Gulf Coast through Texas, Oklahoma, Kansas, Nebraska, South Dakota, and up into Canada. Look at that list of states and compare it to the state-by-state burden data above: the overlap is almost complete.
The Central Flyway is essentially a WNV transmission highway. Birds carry the virus north as they migrate in spring, infecting mosquito populations along the route. By the time the birds reach their summer breeding grounds in the Northern Plains and Canada, local mosquito populations have been seeded. Then in fall, when birds migrate south again, they carry the virus back through the same corridor.
The Nebraska and South Dakota per-capita anomaly mentioned earlier is largely explained by their position at the convergence of enormous bird migration traffic, vast agricultural irrigation, and a short but hot summer that allows mosquito populations to explode rapidly.
The Mississippi Flyway
Runs along the Mississippi River corridor from the Gulf of Mexico through Louisiana, Mississippi, Tennessee, Illinois, Wisconsin, and Minnesota. This flyway explains why Illinois and the Chicago metro consistently see WNV activity despite being a northern state with real winters — it’s positioned directly on one of the most heavily traveled bird migration routes on the continent.
The Mississippi River itself and its extensive floodplain wetlands, oxbow lakes, and agricultural drainages create near-ideal mosquito habitat directly in the path of this bird traffic. The correlation between the flyway and WNV case concentrations in counties along the river is striking when you map it out.
The Atlantic Flyway
Runs along the East Coast from Florida up through the mid-Atlantic states and into New England. This flyway is responsible for WNV activity in New York, New Jersey, Pennsylvania, Maryland, Virginia, and the Carolinas. It’s also the flyway that brought WNV to the US in the first place — the 1999 New York City outbreak is believed to have resulted from an infected bird (or mosquito) arriving via this corridor.
Atlantic Flyway states tend to have a somewhat compressed WNV season compared to Central Flyway states, partly because the cooler northern climate limits the transmission window, and partly because WNV has never achieved the same intensity of amplification in East Coast bird populations that it has in the West and Midwest.
Interactive chart showing the four US bird migration flyways and their correlation with West Nile Virus transmission intensity
Bird Migration Flyways and West Nile Virus Transmission Intensity
How West Nile Virus Season Progresses Within a Single Year: The Wave Pattern
It’s not enough to know when the season starts in your state. Understanding how the season actually builds, peaks, and declines within a year gives you a much more nuanced picture of when your risk is genuinely elevated — and when you can reasonably relax your guard.
WNV season doesn’t arrive uniformly. It moves in a wave — starting in the South, spreading north and west, peaking in multiple regions at slightly different times, then receding from north to south as fall arrives. This wave pattern is remarkably consistent from year to year.
Phase 1: Southern Seeding (April–May)
The season always begins in the Gulf Coast states, Texas, Arizona, and Southern California. In April, mosquito populations in these areas reach the density needed to sustain meaningful bird-to-mosquito-to-bird transmission cycles. The virus starts amplifying in local bird populations.
At this stage, human cases are rare. The virus is circulating, but primarily between birds and mosquitoes. The infection rate in mosquito pools — the percentage of trapped mosquitoes that test positive for WNV — is still low. Public health surveillance programs begin active monitoring.
Think of this phase as the virus “loading up” in the reservoir host population. The more infected birds become, the more infected mosquito bites occur, the more the amplification cycle accelerates.
Phase 2: Northward Spread and Amplification (June–July)
By June, WNV activity has expanded significantly. Texas, the entire Gulf Coast, Arizona, California’s Central Valley, and the Southern Plains are all seeing active transmission. The first human cases of the season begin appearing — typically in Texas, Arizona, and California first, then spreading to the Midwest.
In June, the bird migration cycle has positioned infected birds throughout the country. Mosquito populations in the Midwest and Northern Plains are now at sufficient density to pick up the virus from these birds and begin local amplification.
July is when things accelerate fast. Hot temperatures speed up the extrinsic incubation period of the virus in mosquitoes — the time between a mosquito feeding on an infected bird and becoming capable of infecting a human. At temperatures above 86°F (30°C), this incubation period can drop to as few as 4 days, compared to 2 weeks or more in cooler conditions. Warmer weather means faster virus development inside mosquitoes, which means faster human case escalation.
By mid-July, WNV activity is measurable in virtually every US state where transmission occurs regularly.
Phase 3: National Peak (August)
August is the peak month for West Nile Virus in the United States. This holds true across virtually every region, every year, with remarkable consistency. The CDC’s historical case data shows August as the single highest-case month in 19 of the 24 years from 1999 to 2023.
Why August specifically? Several converging factors:
- Mosquito populations are at their annual maximum — they’ve had the entire spring and early summer to build up
- Bird populations have been amplifying the virus for 3–4 months, meaning a high percentage of local birds carry antibodies (or active infections in younger birds hatched that summer who haven’t yet been exposed)
- The extrinsic incubation period in mosquitoes is at its shortest due to peak summer heat
- People are outside more — outdoor recreation, evening activities, travel — increasing exposure opportunities
- In northern states, this is the only month of intense transmission, compressing the season’s entire risk into a single month
During August, the positive mosquito pool rate (the proportion of trapped mosquito batches testing positive for WNV) peaks across multiple surveillance regions simultaneously. County health departments in Texas, Arizona, California, Illinois, Colorado, and the Plains states are all managing active cases at the same time.
Phase 4: Northern Pullback, Southern Persistence (September)
September brings the first real divergence between northern and southern WNV season dynamics. As nights cool in Minnesota, Wisconsin, Michigan, and the northern Plains, Culex mosquito activity begins dropping sharply. Case counts in those states fall quickly — often to near-zero by late September.
But in Texas, Arizona, California, Louisiana, and Florida, September remains a genuinely high-risk month. Temperatures are still warm. Mosquito populations haven’t collapsed yet. The season in these states has weeks left to run.
September in the South and Southwest can actually see secondary spikes — particularly if late-summer rainfall has created new breeding sites, or if a warm fall extends mosquito activity beyond normal. The Texas Gulf Coast, in particular, regularly reports significant September case counts.
Phase 5: Season End — The North-to-South Fade (October–November)
By October, WNV transmission has essentially ended everywhere north of roughly the 40th parallel (roughly the latitude of Denver, Indianapolis, and Philadelphia). Nighttime temperatures consistently below 50°F shut down Culex mosquito activity. The surveillance data shows it clearly — positive pool rates drop to near-zero in northern states while southern states are still recording cases.
In Texas, Louisiana, Mississippi, and Georgia, October is still a meaningful risk month, though case counts are declining from their September levels. In Arizona, October remains moderately active. In south Florida, the season persists through November and sometimes into December.
The last documented WNV transmission of any given year in the continental US almost always occurs in Florida, Texas, or Arizona.
Interactive step-by-step diagram showing how West Nile Virus season progresses in five phases from April through November across US regions
How WNV season progresses within a single year — the wave pattern
How West Nile Virus Season Changes Year Over Year: Annual Variability and Long-Term Trends
This is where things get genuinely interesting — and genuinely concerning. West Nile Virus season doesn’t just repeat the same pattern with the same intensity every year. It fluctuates. Some years are dramatically worse than others. And over the 25-year history of WNV in the US, there are identifiable long-term trends that public health researchers are monitoring closely.
The Year-to-Year Swings: What Drives a Bad WNV Year
Not all West Nile Virus seasons are equal. The difference between a mild year and a severe outbreak year can be tens of thousands of cases. Several factors drive these swings:
- Winter temperatures and spring arrival: A mild winter followed by an early warm spring accelerates mosquito emergence. When temperatures reach threshold levels in April rather than May, the transmission cycle gets a head start that compounds through the entire season. Conversely, a cold, late spring delays and compresses the season.
- Spring and summer rainfall patterns: This is arguably the single most important short-term driver of WNV season severity. Rainfall creates standing water — breeding habitat. A wet spring followed by a hot, dry summer is the worst-case combination: the rain creates massive breeding habitat, the heat accelerates mosquito development and virus incubation, and the dry conditions concentrate birds and mosquitoes around remaining water sources, intensifying the transmission cycle.
- Drought and water concentration: Counterintuitively, drought can worsen WNV transmission in some situations. When water sources concentrate — irrigation canals, retention ponds, any remaining standing water — both birds seeking water and mosquitoes breeding in those spots converge in the same locations. This concentration effect amplifies the bird-mosquito contact rate and can drive rapid virus amplification.
- Bird population immunity dynamics: This is more complex and operates on a slower timescale. After a major WNV outbreak, a large proportion of local bird populations develop antibodies to the virus. The following 1–3 years may see reduced transmission because fewer birds are available as susceptible amplifying hosts. But as new generations of birds hatch — without maternal immunity, or with immunity that has waned — the susceptible population rebuilds. This immunity cycling may partly explain the irregular multi-year boom-bust pattern seen in WNV case data.
- New mosquito generations (voltinism): Culex mosquitoes in warm climates can complete multiple generations per season. Each new generation represents an opportunity for new infections from birds. Later in a warm summer, the accumulated virus in bird populations means later mosquito generations have a higher probability of picking up the infection on their first blood meal.
Notable WNV Seasons: The Worst Years in US History
Looking at year-over-year case data from the CDC provides a fascinating and sobering picture of how variable WNV season severity can be:
| Year | Reported Cases | Deaths | Notable Characteristics |
| 1999 | 62 | 7 | First US detection; limited to New York City metro; crow die-offs provided early warning |
| 2002 | 4,156 | 284 | Explosive first nationwide spread; all 48 contiguous states within range; blood supply contamination discovered |
| 2003 | 9,862 | 264 | Largest outbreak to that date; Colorado and Nebraska hardest hit; blood supply screening implemented |
| 2004 | 2,539 | 100 | Significant decline from 2003 peak; California emerged as major transmission state |
| 2005 | 3,000 | 119 | Moderate year; Gulf Coast states particularly active |
| 2006 | 4,269 | 177 | Second major peak; California, Colorado, South Dakota leading states |
| 2007 | 3,630 | 124 | Moderate; Texas and California leading contributors |
| 2008 | 1,356 | 44 | One of lowest years; drought conditions in some regions reduced standing water |
| 2009 | 720 | 32 | Lowest year on record at that time; La Nina weather pattern, cool wet spring in many regions |
| 2010 | 1,021 | 57 | Modest rebound; Texas and California driving most cases |
| 2011 | 712 | 43 | Another low year; La Nina, above-average rainfall, cool temperatures |
| 2012 | 5,674 | 286 | Worst outbreak in US history; extreme heat and drought across the Midwest and South; Texas and Dallas particularly devastated |
| 2013 | 2,469 | 119 | Significant decline from 2012; California’s Central Valley had worst-ever year |
| 2014 | 2,205 | 97 | Continued moderate activity; California drought beginning to affect patterns |
| 2015 | 2,175 | 119 | California in severe drought — concentration effect drove high state case counts |
| 2016 | 2,038 | 94 | Moderate year; national case counts relatively stable |
| 2017 | 2,002 | 97 | Moderate; Texas and California leading |
| 2018 | 2,647 | 167 | Elevated year; hot dry summer across South and Southwest |
| 2019 | 958 | 43 | Notable low; cool wet spring in many transmission regions delayed season |
| 2020 | 1,125 | 59 | COVID-19 complicated surveillance; actual cases likely undercounted |
| 2021 | 1,626 | 88 | Moderate rebound; Western heat dome event affected Pacific Coast transmission |
| 2022 | 1,126 | 90 | Continued moderate activity; Texas and California primary drivers |
| 2023 | ~2,400 | ~90 | Active year; Southwest and Southern Plains above average; late-season Texas activity |
The 2012 outbreak stands apart. It wasn’t just the largest in US history — it was the largest by a dramatic margin. The conditions that year were near-perfect for WNV: a record-breaking heat wave across the Midwest and South, severe drought that concentrated birds and mosquitoes around remaining water sources, and an early warm spring that gave the transmission cycle a 3–4 week head start.
Dallas County, Texas became the epicenter, with aerial mosquito spraying deployed over residential neighborhoods for the first time since the 1960s.
The low years — 2009, 2011, 2019 — tend to correlate with La Niña weather patterns, above-average rainfall in the early season (which can paradoxically both create breeding habitat and wash out existing mosquito larvae), and cooler-than-average summer temperatures that slow the virus’s development inside mosquitoes.
The Long-Term Trend: Is West Nile Virus Season Getting Longer and Worse?
This is the question that public health researchers are taking seriously, and the honest answer is: yes, there are measurable long-term trends that point toward a longer, more geographically expansive WNV season over time.
- Temperature trends: Average temperatures across the continental US have risen measurably over the past 25 years. This directly affects the WNV transmission season in two ways — it pushes the start of the season earlier and the end later, expanding the total transmission window. Research published in academic journals tracking Culex mosquito phenology has found season-length increases of 2–4 weeks in some regions compared to baseline periods in the 1980s and 1990s.
- Geographic range expansion: When WNV first arrived in 1999, it took three years to spread to all 48 contiguous states. Since then, it has been detected in virtually every county in the country. But beyond simple presence, the range of states with consistently high case counts has expanded over time. States like Colorado, Nebraska, and the Dakotas were not historically considered high-risk for mosquito-borne illness. They are now.
- Urban heat islands: Cities are warmer than surrounding rural areas, and that difference matters for WNV season. Urban heat islands in major metro areas — Phoenix, Dallas, Chicago, Los Angeles — can extend the local mosquito season by 2–3 weeks compared to the surrounding suburbs and rural areas. As urban populations grow, more people are living in these extended-season environments.
- Shifting precipitation patterns: Climate change is altering rainfall distribution — more intense precipitation events interspersed with longer dry periods. This boom-bust precipitation pattern creates episodic pulses of mosquito breeding habitat (after intense rains) followed by concentration effects (during dry periods). Some modeling research suggests this pattern is particularly favorable for Culex mosquito population spikes and WNV amplification.
- Earlier migratory bird arrivals: Some bird species are arriving at northern breeding grounds earlier in spring as temperatures warm. This means the bird-mosquito amplification cycle is getting an earlier start in northern states, potentially shifting peak WNV activity in those regions from the traditional August peak toward late July or even mid-July in particularly warm years.
The bottom line on long-term trends: The data points toward a gradual but measurable expansion of the West Nile Virus season — both in length and in geographic intensity. Not every year will be worse than the last. The year-to-year variability driven by weather is still the dominant short-term factor. But the underlying baseline is shifting in a direction that means the average WNV season 20 years from now is likely to be longer and more active than the average WNV season of 20 years ago.
Intra-State Variation: Why West Nile Virus Season Isn’t Uniform Even Within a Single State
Even within a single state, WNV season timing and intensity can vary substantially. This is an often-overlooked level of geographic nuance that matters if you’re trying to assess your actual, local risk.
1. Elevation Effects
In states like Colorado, California, Arizona, and New Mexico, elevation is one of the primary drivers of within-state variation. Denver (5,280 feet) has a measurably shorter WNV season than Pueblo (4,700 feet) or La Junta (4,080 feet) on the southeastern Colorado plains. Phoenix (1,086 feet) has a dramatically longer and more intense WNV season than Flagstaff (6,910 feet), which sits at a high enough elevation that sustained Culex mosquito transmission is rare.
As a general rule, WNV risk drops significantly above 5,000 feet because average summer temperatures don’t consistently reach the threshold needed for rapid virus development in mosquitoes. Mountain resort towns and high-elevation rural areas in Western states are meaningfully lower risk than valley and plains communities.
2. Urban vs. Rural Patterns
The urban-rural WNV pattern varies by region. In the Midwest and Great Plains, the most intense WNV transmission often occurs in agricultural rural areas, where irrigation creates vast mosquito habitat and bird populations are dense. Many of the highest per-capita rural case rates in the country come from irrigation-intensive farming counties in Nebraska, South Dakota, Kansas, and California’s Central Valley.
In the South and Southwest, however, urban and suburban areas often carry higher burdens — this reflects the dominance of Culex quinquefasciatus (the southern house mosquito), which is highly adapted to urban environments and breeds readily in storm drains, neglected pools, and urban water features.
3. River Corridors and Wetlands
Within any state, the highest WNV activity typically clusters along river corridors and near wetlands. The Mississippi River and its tributaries. The Rio Grande. The Sacramento River Valley. The Colorado River and its associated canal systems. The South Platte River along the Front Range. These water corridors concentrate both bird migration traffic and mosquito breeding habitat in the same geographic strips, creating the conditions for intense local amplification.
This means that if you live within 10–15 miles of a major river, wetland complex, or large irrigation canal, your local WNV season may be meaningfully more intense than the state average, regardless of what the statewide statistics say.
How Public Health Surveillance Tracks the Progression of WNV Season in Real Time
One of the things that distinguishes West Nile Virus from many other public health threats is how well-monitored it is. The national WNV surveillance system — CDC ArboNET — has been operating continuously since 2000 and tracks multiple indicators simultaneously. Understanding what these indicators mean helps you interpret WNV news and alerts in your area.
1. Mosquito Pool Testing: The Earliest Warning Signal
Local mosquito control districts and health departments operate networks of mosquito traps throughout the season — typically from May through October. Trapped mosquitoes are pooled by species and location and tested for WNV. The positive pool rate (what percentage of tested pools contain the virus) is one of the first indicators that WNV season is actively underway in a given area.
A positive mosquito pool doesn’t mean a human case is imminent, but it tells health departments that the virus is circulating locally and that the bird-mosquito amplification cycle is active. Rising positive pool rates through June and July are the signal that August is going to be active.
2. Dead Bird Reporting
Corvids — crows, ravens, and jays — are highly susceptible to WNV and die rapidly when infected. Dead crow sightings (and, in some states, reports of dead ravens, hawks, and other birds) are actively monitored as an early-warning indicator that WNV is present in local bird populations. In many states, residents can report dead birds directly to health departments or via apps.
A cluster of dead crows in a neighborhood in late June or July is a meaningful signal that WNV is actively circulating there. It typically precedes the appearance of human cases by 2–4 weeks in the same area.
3. Equine Cases
Horses are also susceptible to WNV and develop neurological disease when infected (unlike humans, a WNV vaccine is available for horses). Equine cases are often reported before human cases because horses are outdoors 24 hours a day and more consistently exposed to mosquitoes than most humans. A cluster of equine neurological cases in a county in July is another indicator that the local WNV season is actively underway.
4. Human Case Reporting
By the time human cases appear in surveillance data, the season is already in full swing — the virus has been circulating in bird and mosquito populations for weeks. Human cases lag behind mosquito pool positivity by roughly 2–4 weeks and lag behind dead bird reports by a similar window.
The CDC updates ArboNET data weekly during the season. Most states also publish their own WNV surveillance dashboards with more geographically specific data. These are genuinely useful resources for understanding whether the season in your specific county is early, late, or tracking at typical levels.
Understanding West Nile Virus Season Is About More Than Just Dates
West Nile Virus season in the United States is not a single, uniform event. It’s a geographically complex, annually variable, climate-sensitive public health phenomenon that unfolds differently depending on where you live, what year it is, what the winter and spring weather looked like, and what bird migration patterns are doing.
The season starts in March or April in southern Texas and Florida and doesn’t fully arrive in Minnesota or Wisconsin until June. It peaks in August almost everywhere, but that August peak is sharper and more compressed in the North and longer and more diffuse in the South. It ends in September in the northern tier states and persists through November in the Gulf Coast and desert Southwest.
Year to year, the variation is enormous. 2009 and 2011 saw fewer than 750 cases nationally. 2012 saw nearly 5,700. The difference was weather — the same underlying ecology, dramatically amplified by the right (or wrong) combination of heat and drought.
And over the long term, the season is gradually shifting. Warmer temperatures are lengthening the transmission window. Geographic range is expanding. The states that see the highest burden are changing. West Nile Virus, 25 years after its arrival in the US, is not a static threat — it’s an evolving one.
The most useful thing anyone living in the continental United States can take from this article is a clear-eyed understanding of their local season timing. Know when it starts in your state. Know your peak month. Know whether your county’s geography — its proximity to rivers, irrigation canals, wetlands, or major bird migration corridors — puts you in a higher-risk category than the state average. And pay attention to your local health department’s WNV surveillance updates when the season arrives.
The season follows a pattern. But within that pattern, details matter enormously — and the details are local.
Have you noticed West Nile Virus season behaving differently in your area compared to previous years? Do you live in a state or county that sees unusual WNV activity — either earlier, later, or more intense than the regional averages suggest?
Share your observations in the comments below. Real, on-the-ground observations from people across the country add genuine value to the understanding of how this season unfolds in practice, not just in surveillance data.
References and Sources
- CDC ArboNET — National West Nile Virus Surveillance System. Annual case data 1999–2023.
- CDC. (2024). West Nile Virus: Epidemiology and Geographic Distribution. Division of Vector-Borne Diseases.
- Reisen, W.K. (2013). Ecology of West Nile Virus in North America. Viruses, 5(9), 2079–2105.
- Kilpatrick, A.M. (2011). Globalization, land use, and the invasion of West Nile Virus. Science, 334(6054), 323–327.
- Soverow, J.E., et al. (2009). Infectious disease in a warming world: how weather influenced West Nile Virus in the United States. Environmental Health Perspectives, 117(7), 1049–1052.
- Paz, S. (2015). Climate change impacts on West Nile Virus transmission in a global context. Philosophical Transactions of the Royal Society B, 370(1665).
- Lebl, K., et al. (2013). Predicting West Nile Virus risk from weather conditions. Epidemiology and Infection, 141(6), 1300–1308.
- Hartley, D.M., et al. (2012). Effects of temperature on emergence and seasonality of West Nile Virus in California. American Journal of Tropical Medicine and Hygiene, 86(5), 884–894.
- Degroote, J.P., Sugumaran, R., Brend, S.M., et al. (2008). Landscapes, demographics, and environmental factors related to West Nile Virus in Iowa. International Journal of Health Geographics, 7, 60.
- Dallas County Health and Human Services. (2012). West Nile Virus Outbreak — Dallas County, Texas, 2012 Surveillance Report.
- Ruiz, M.O., et al. (2010). Local impact of temperature and precipitation on West Nile Virus infection in Culex species mosquitoes in northeast Illinois. Parasites & Vectors, 3, 19.