Table of Contents
1. Executive Summary
This US Mosquito Report consolidates the most current publicly available U.S. mosquito data through early 2026, drawing on surveillance records from the CDC ArboNET system, CDC Morbidity and Mortality Weekly Reports (MMWR), CDC Health Alert Network (HAN) advisories, EPA vector-control resources, and market intelligence from the mosquito control industry. Where 2026 data are unavailable or incomplete, data from the 2024 and 2025 seasons are cited with source dates noted. All forward-looking estimates are labeled Projected 2026 Estimate.
Key Confirmed Findings:
- 176 recognized mosquito species exist in the United States [1], spanning all 50 states and U.S. territories.
- West Nile virus (WNV) remains the leading mosquito-borne disease in the contiguous U.S. The CDC MMWR (2025) states WNV causes an average of approximately 2,000 disease cases annually, including approximately 1,200 neuroinvasive cases and 120 deaths [2]. In 2024 (preliminary, as of Jan 16, 2026), 1,791 human WNV cases were reported to ArboNET, including 161 fatalities [3].
- In 2025, WNV activity increased substantially. AMA infectious-diseases director Dr. Erica Kaufman West stated at an AMA-CDC joint webinar (December 5, 2025): ‘In 2025, there’s been a substantial increase in West Nile virus activity with 41% more severe-disease cases and 32% more deaths than what is typically seen with West Nile disease’ [4]. Over 2,000 WNV cases were reported as of December 17, 2025 [5].
- Dengue fever reached record levels in the Americas in 2024 (13 million cases regionally). In Puerto Rico, 6,291 dengue cases were confirmed, with 52.3% hospitalized and 11-13 fatalities reported (11 per MMWR [6]; 13 per CDC HAN-00523 [7] as a later operational count).
- EEE in 2024: 19 human cases reported across 9 states (MA 4, NH 5, NY 2, NJ 2, VT 2, RI 1, WI 1, ME 1, NC 1). Thirteen of 19 cases occurred in New England states [3]. The national annual average is 11 cases [8].
- More than two-thirds of the contiguous U.S. experienced an increase in ‘mosquito days’ over the past four decades, with the Northeast seeing the largest increases; some cities gained 13-17 additional mosquito-suitable days compared to the 1980-2009 baseline [9].
- The U.S. mosquito control market was valued at approximately $1.87 billion in 2024, with a projected compound annual growth rate of 6.5% through 2031 [10].
- Published climate modeling projects that by 2050, warming autumns and earlier springs could extend the U.S. mosquito season by up to two months in affected regions [11].
- Projected 2026 Estimate: Continued range expansion of Aedes aegypti and Aedes albopictus into previously unaffected northern states is expected, elevating localized dengue transmission risk in new geographies.
Note on case counts: Reported cases represent confirmed, notifiable-disease reports submitted to ArboNET. Because the majority of WNV infections are asymptomatic (approximately 80%) and mild non-neuroinvasive illness is significantly underreported, true incidence substantially exceeds all reported figures cited in this report [2].
2. Mosquito Species in the United States
2.1 Total Species Count
There are over 3,000 mosquito species worldwide [1]. Within the United States, 176 species are recognized by entomologists, as documented by the American Mosquito Control Association [1]. A small subset are medically significant vectors of human disease. The three genera of primary public health concern in the United States are:
- Aedes spp. — Primary vectors for dengue, Zika, chikungunya, and yellow fever. Key U.S. species: Ae. aegypti (yellow fever mosquito) and Ae. albopictus (Asian tiger mosquito) [12].
- Culex spp. — Primary vectors for West Nile virus and St. Louis encephalitis. Key U.S. species: Cx. pipiens, Cx. tarsalis, Cx. quinquefasciatus [12].
- Anopheles spp. — Primary vectors for malaria. Key U.S. species: An. freeborni and An. quadrimaculatus [12].
2.2 Regional Distribution of Key Vector Species
| Species | Common Name | Primary U.S. Region(s) | Diseases Vectored | Source |
| Aedes aegypti | Yellow fever mosquito | South/Southeast; coastal Gulf states; FL, TX, CA | Dengue, Zika, Chikungunya, Yellow Fever | [12] |
| Aedes albopictus | Asian tiger mosquito | Southeast, Mid-Atlantic, expanding into Northeast and Midwest | Dengue, Chikungunya, Zika | [12] |
| Culex pipiens | Northern house mosquito | Northeast, Midwest, Pacific Northwest | West Nile Virus, St. Louis Encephalitis | [12] |
| Culex tarsalis | Western encephalitis mosquito | Great Plains, Western U.S. | West Nile Virus, Western Equine Encephalitis | [12] |
| Culex quinquefasciatus | Southern house mosquito | South, Southeast, California | West Nile Virus, St. Louis Encephalitis | [12] |
| Anopheles quadrimaculatus | Common malaria mosquito | East of the Mississippi River | Malaria (locally acquired transmission rare) | [12] |
| Anopheles freeborni | Western malaria mosquito | Pacific Coast, western states | Malaria (locally acquired transmission rare) | [12] |
| Culiseta melanura | Black-tailed mosquito | Atlantic/Gulf Coast swamps; freshwater hardwood swamps in New England | Eastern Equine Encephalitis (primary enzootic vector) | [12][13] |
Sources: CDC [12]; American Mosquito Control Association [1]; EPA [13]. Note: This table covers medically significant species only; 176 total U.S. species are not all listed here.
3. Mosquito Population Density by U.S. Region
Mosquito population density is influenced by temperature, precipitation or rainfall, standing water availability, and vegetation cover. No federal database maintains a single, standardized national mosquito density count; density levels below represent qualitative assessments derived from published surveillance activity reports, entomological field studies, and state vector-control program data. ‘Estimated Density Level’ is a composite index and should not be interpreted as a measured population figure.
| Region | Estimated Density Level | Climate Factors | Notes |
| Southeast (FL, GA, AL, MS, LA, SC) | Very High | Subtropical humidity, year-round warmth, frequent rainfall, abundant standing water | FL and LA consistently rank among highest-activity states in CDC WNV surveillance [3] |
| Gulf Coast (TX, LA) | Very High | High humidity, tropical storm-created standing water, mild winters | TX led all states with 176 WNV cases in 2024 per CDC ArboNET [3] |
| Mid-Atlantic (VA, MD, DE, NJ, NC) | High | Hot humid summers, moderate winters, coastal wetlands | Ae. albopictus established; EEE documented in NJ (2 cases) and NC (1 case) in 2024 [3] |
| Midwest (IL, IN, OH, MO, MN, WI) | Moderate to High | Warm summers with heavy rainfall, abundant agricultural water | IL reported 59 WNV cases in 2024; MN reported 35 [3][14] |
| Great Plains (NE, KS, OK, ND, SD) | Moderate to High | Hot summers; agricultural irrigation provides breeding habitat | NE reported 92 WNV cases in 2024 — 4th highest nationally [3] |
| Pacific Coast (CA, OR, WA) | Moderate | Mediterranean climate in CA; temperate in Pacific NW; irrigation-dependent breeding | CA reported 123 WNV cases in 2024 — 2nd highest nationally; local dengue confirmed [3] |
| Mountain West (CO, UT, AZ, NV, NM) | Moderate | Arid conditions limit density; monsoon season creates temporary surge | CO reported 76 WNV cases in 2024 — 5th highest nationally [3] |
| Northeast (NY, PA, CT, MA, RI, VT, NH, ME) | Moderate | Warm summers with high rainfall; historically shorter season, now lengthening | EEE elevated in 2024: 13 of 19 national cases in New England [3]; mosquito season expanding [9] |
| Hawaii & U.S. Territories | High to Very High | Tropical climate, year-round mosquito activity | PR declared dengue public health emergency 2024 (6,291 cases); USVI outbreak 2024; American Samoa outbreak July 2025 [7][15] |
| Alaska | Low to Moderate (seasonal) | Arctic to subarctic; activity confined to brief summer; tundra pools abundant in summer | No locally transmitted mosquito-borne diseases documented; nuisance biting only |
Sources: CDC ArboNET 2024 [3]; EPA [13]; American Mosquito Control Association [1]. Density ratings are qualitative and not derived from a single standardized federal measurement system.
4. Mosquito Bite Rate Statistics
No federal agency — including CDC, EPA, or USDA — collects standardized per-capita mosquito bite rate data for the general U.S. population. This data point is not publicly available. The following table presents bite risk levels derived from seasonal vector surveillance activity, mosquito density reports, and entomological assessments published by the CDC and partner agencies. ‘Bite Risk Level’ is a qualitative composite index and does not represent a measured individual bite frequency.
| Month | Bite Risk Level | Contributing Factors | Geographic Notes |
| January | Very Low | Cold temperatures suppress adult mosquito activity in nearly all states | Active only in South Florida, southern Texas, Hawaii, and U.S. territories year-round |
| February | Very Low | Winter dormancy persists across most regions | Gulf Coast and South Florida may see early nuisance activity in warm years |
| March | Low | Larval development begins in southern states as temperatures increase above 50°F | Southeast and Gulf Coast see first-season activity; northern states dormant |
| April | Low to Moderate | Overwintering Aedes eggs hatch; Culex species emerge in warm southern regions | Activity expands into Mid-Atlantic; Northeast and Midwest still largely dormant |
| May | Moderate | Temperatures above 50°F in most of the contiguous U.S.; broad breeding season begins | Northeast and Midwest season underway; Gulf Coast and Southeast moderately active |
| June | High | Peak breeding conditions; warm temperatures post-rainfall create standing water widely | All lower 48 states active; Gulf Coast and Southeast approaching peak |
| July | Very High | Peak activity month nationally; maximum temperatures and humidity; optimal mosquito development | Highest bite exposure month in most regions; WNV transmission begins escalating nationally [3] |
| August | Very High | Continued peak activity; highest WNV human case reporting nationally [3] | CDC ArboNET data show majority of annual WNV cases onset in July–September [2] |
| September | High | Activity declines gradually in northern states; South and Southeast remain active | EEE transmission peak historically; WNV cases plateau; Great Lakes and Northeast cooling |
| October | Moderate | Activity significantly reduced north of 40th parallel; South/Southeast still active | Gulf Coast and Florida maintain moderate activity into late October |
| November | Low | First hard frost kills adult populations in most regions; activity isolated to extreme South | Florida, Hawaii, and territories maintain activity |
| December | Very Low | Dormancy across nearly all of the country | Hawaii and Puerto Rico maintain year-round activity; South Florida sporadically active |
Sources: CDC ArboNET seasonal patterns [2][3]; EPA mosquito biology [13]; Climate Central mosquito suitability analysis [9]. Risk levels are qualitative; individual exposure varies by local habitat, personal protective measures, and proximity to standing water.
Data point not publicly available: A national annual mosquito bite rate per person for the United States does not exist in any publicly accessible federal or academic dataset reviewed for this report.
5. Mosquito-Borne Disease Data (Latest Confirmed + 2026 Outlook)
5.1 Confirmed Case Data Table
| Disease | Confirmed Cases | States/Territories Affected | Year & Data Status | Trend |
| West Nile Virus (WNV) | Long-run avg: ~2,000 cases/year, ~1,200 neuroinvasive, ~120 deaths [2] 2024: 1,791 total cases, 1,335 neuroinvasive (74.5%), 161 deaths [3] 2023: 2,628 cases, 2,022 hospitalizations, 208 deaths [2] 2025 (preliminary): >2,000 cases as of Dec 17, 2025 [4][5] | All 48 contiguous states. 2024 top 5 by case count: TX (176), CA (123), NY (98), NE (92), CO (76) [3] | 2024 data: preliminary, ArboNET as of Jan 16, 2026 [3] | Increasing (2025 above-average season confirmed by AMA-CDC) |
| Dengue Fever | Puerto Rico 2024: 6,291 confirmed cases (191.4 per 100,000); 52.3% hospitalized; 264 severe dengue; 11 deaths (MMWR [6]) / 13 deaths (HAN-00523 [7] — later running total) USVI 2024: 208 locally acquired cases [7] Continental U.S.: Local transmission confirmed in CA, FL, TX in 2024 [15] | Territories: PR, USVI (outbreak 2024), American Samoa (outbreak Jul 2025). Continental: FL, TX, CA local transmission 2024 [15] | 2024 data: MMWR Feb 20, 2025 [6]; HAN Mar 2025 [7] | Strongly Increasing (record Americas-wide year 2024: 13M cases [6]) |
| Zika Virus | 2024-2025: No sustained local transmission in continental U.S. Travel-associated cases continue sporadically. 2024-2025 ArboNET: 28 total cases, 19 travel-associated; 9 locally acquired in Puerto Rico [3-ArboNET table] | No continental U.S. local outbreak since FL/TX 2016-2017. Puerto Rico: periodic ongoing risk. Travel-associated: all 50 states | 2024-2025 ArboNET provisional [3] | Stable (no continental outbreak; Puerto Rico endemic risk ongoing) |
| Eastern Equine Encephalitis (EEE) | 2024: 19 human cases, all neuroinvasive [3]. 13 of 19 in New England (MA 4, NH 5, VT 2, RI 1, ME 1). Also: NY (2), NJ (2), WI (1), NC (1). 2025: 19 cases, 5 deaths across 9 states per ArboNET Jan 14, 2026 [3]. National annual average: 11 cases [8] | 2024: 9 states — MA, NH, NY, NJ, VT, RI, WI, ME, NC [3] 2025: 9 states (same states + varies) [3] | 2024 preliminary; 2025 provisional ArboNET [3]. CDC notes average 11 cases/year [8] | Above average in 2024 (cyclical pattern; 2019 record: 38 cases) |
| Malaria | 2023: First locally acquired cases since 2003 — 8 cases in FL, 1 in TX, 1 in MD, 1 in AR [12]. 2024: Locally acquired cases still under surveillance; enhanced monitoring ongoing. Travel-associated cases reported annually from all states with international travel. | Locally acquired 2023: FL, TX, MD, AR. Travel-associated: all 50 states. Anopheles vectors present broadly east of Mississippi [12] | 2023 (most recent year with confirmed local cases) [12] | Stable to Watch (locally acquired remains exceptional; 2023 reappearance warrants continued surveillance) |
5.2 2025 Disease Activity Notes
West Nile Virus 2025: AMA infectious-diseases director Dr. Erica Kaufman West confirmed at an AMA-CDC joint webinar (December 5, 2025) that 2025 saw ‘41% more severe-disease cases and 32% more deaths than what is typically seen with West Nile disease’ [4]. As of December 17, 2025, over 2,000 individuals were reported infected [5]. Colorado led the 2025 season with 284 cases as of that date [5].
Dengue 2025: Puerto Rico’s public health emergency, declared March 2024, was extended through December 2025 by the Puerto Rico Department of Health [15]. As of March 7, 2025, 936 cases had been reported — a 113% increase compared to the same period in 2024 [7]. American Samoa declared a dengue outbreak on July 7, 2025 [15].
5.3 Projected 2026 Outlook
Projected 2026 Estimate: Based on confirmed 2025 elevated WNV activity and sustained dengue pressure in U.S. territories, public health agencies are expected to maintain heightened vector-borne disease surveillance.
Published vector ecology research from the University at Albany (September 2024) attributes dengue risk expansion in California, Arizona, and the Carolinas to range extension of Ae. aegypti and Ae. albopictus [16]. EEE follows a documented cyclical pattern; 2026 risk in New England is uncertain but warrants continued monitoring. No confirmed 2026 outbreak data exist as of this report’s publication date.
6. Top 10 States With Highest Mosquito-Borne Illness Reports
| Rank | State | 2024 WNV Cases [3] | Additional Disease Burden | Key Contributing Factors |
| 1 | Texas | 176 (leads all states) | Local dengue transmission confirmed 2024 [15] | Large population, warm climate, urban Culex habitat, international travel gateway |
| 2 | California | 123 | Local dengue 2024; first locally acquired case confirmed [15] | Large population, Culex tarsalis range, irrigated agriculture, expanding Aedes |
| 3 | New York | 98 | EEE 2 cases (2024) [3] | Urban Culex pipiens density; first EEE case in NY since 2015; international travel |
| 4 | Nebraska | 92 | — | Culex tarsalis in agricultural plains, migratory bird flyways; high per-capita WNV burden |
| 5 | Colorado | 76 | — | Irrigated agriculture supports Culex tarsalis; warm Front Range summers |
| 6 | Pennsylvania | 61 | — | Dense population, suburban/rural mix, Culex pipiens established |
| 7 (tie) | Illinois | 59 | — | Urban and agricultural Culex habitat; large population center in Chicago metro |
| 7 (tie) | Mississippi | 59 | — | Subtropical climate, year-round Culex activity, rural population distribution |
| 9 (tie) | Georgia | 53 | — | Expanding Aedes albopictus range; warm humid climate; urban Culex |
| 9 (tie) | Louisiana | 53 | — | Subtropical wetlands, Year-round Culex activity, tropical storm flooding |
Note: Massachusetts (#8 in EEE burden with 4 cases in 2024) and New Hampshire (#1 in EEE with 5 cases in 2024) would rank prominently if EEE burden alone were used; their WNV totals (19 and 1 respectively) are lower. Puerto Rico, not ranked here as a state, reported 6,291 dengue cases in 2024 — far exceeding any continental state [6].
Source: CDC ArboNET 2024 provisional data, current as of January 16, 2026 [3].
7. State-by-State Mosquito Season Guide (All 50 States)
Season timings are based on average annual climate patterns, published state vector-control program reports, and CDC entomological guidance. Actual conditions vary by year, elevation, and local microclimate. ‘Season Start’ refers to consistent adult mosquito activity; ‘Season End’ refers to final hard freeze or sustained temperatures below 50°F. Risk Level reflects both nuisance bite pressure and vector-borne disease history combined.
Precise statewide mosquito season boundaries by start/end date are not published as a unified federal dataset; dates represent regional averages derived from CDC seasonal surveillance patterns and state health department reports.
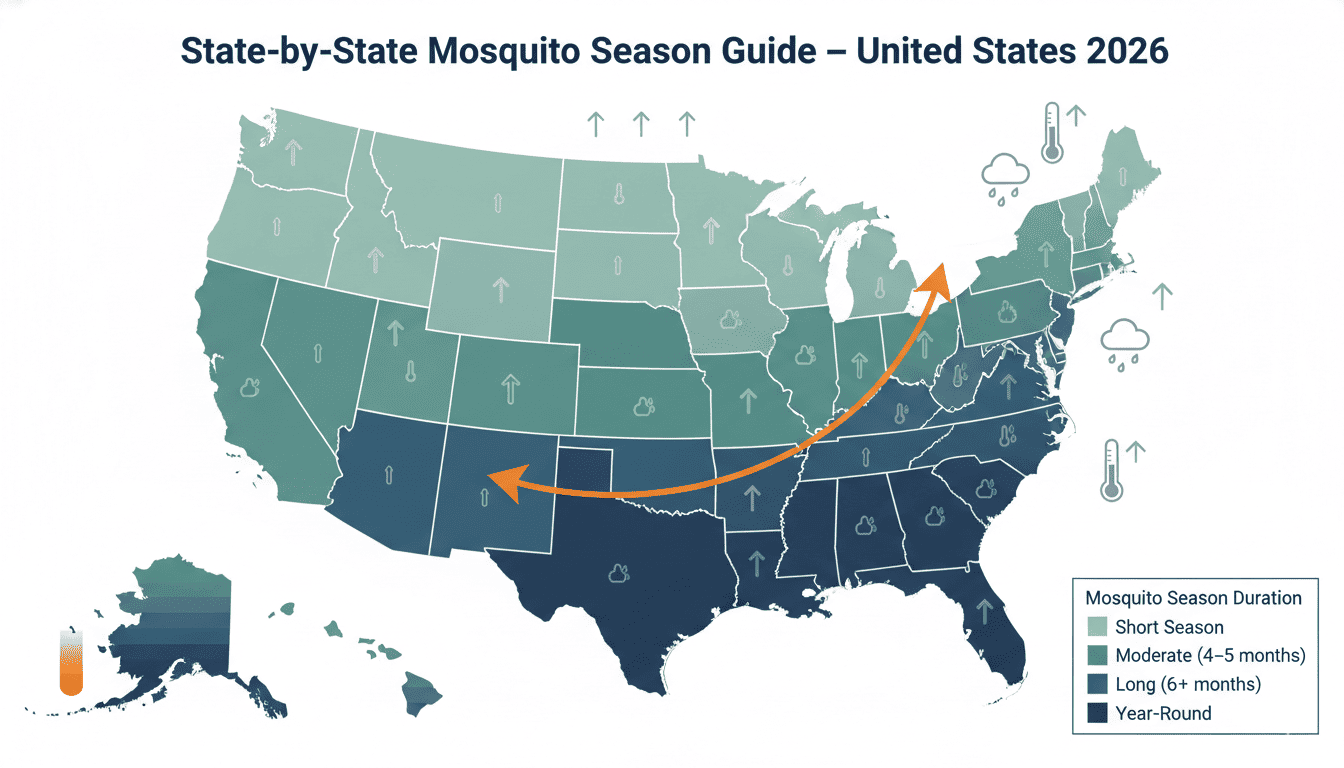
NOTE: The above visual is for illustrative purposes only and does not represent precise data trends; please refer to the detailed table below for confirmed figures.
| State | Season Start (Avg.) | Peak Months | Season End (Avg.) | Risk Level | Notes |
| Alabama | March | June–August | November | High | Subtropical; high Aedes and Culex activity |
| Alaska | June | July | August | Low | Nuisance biting only; no documented local MBD transmission |
| Arizona | March | June–September | November | Moderate | 2024 WNV: 31 cases; local dengue confirmed 2024 [3][15] |
| Arkansas | March | June–August | October | High | Culex quinquefasciatus dominant; WNV burden moderate |
| California | March–April | June–September | October–November | High | 2024 WNV: 123 cases; local dengue 2024 [3][15] |
| Colorado | April–May | July–August | September | Moderate–High | 2024 WNV: 76 cases; 5th highest nationally [3] |
| Connecticut | May | July–August | October | Moderate–High | EEE risk; expanding Ae. albopictus |
| Delaware | April–May | July–August | October | Moderate | 2024 WNV: 2 cases [3] |
| Florida | January (S. FL) | May–October | Year-round in S. FL | Very High | Local dengue transmission 2024 and 2025 [15]; year-round Aedes activity |
| Georgia | March | June–September | November | High | 2024 WNV: 53 cases [3]; Ae. albopictus well established |
| Hawaii | Year-round | Year-round | Year-round | High | Ae. aegypti and Ae. albopictus present; dengue risk for residents and travelers |
| Idaho | May | July–August | September | Low–Moderate | 2024 WNV: 6 cases [3] |
| Illinois | April–May | July–August | October | Moderate–High | 2024 WNV: 59 cases [3]; urban Culex pipiens dominant |
| Indiana | April–May | July–August | October | Moderate | 2024 WNV: 11 cases [3] |
| Iowa | April–May | July–August | October | Moderate | 2024 WNV: 21 cases [3] |
| Kansas | April | June–September | October | Moderate–High | 2024 WNV: 23 cases [3] |
| Kentucky | April | June–August | October | Moderate | 2024 WNV: 9 cases [3] |
| Louisiana | February–March | May–October | December | Very High | 2024 WNV: 53 cases [3]; extensive coastal wetlands |
| Maine | May–June | July–August | September | Moderate | EEE 1 case in 2024 [3]; Culiseta melanura in swamps |
| Maryland | April–May | July–August | October | Moderate | 2024 WNV: 23 cases [3] |
| Massachusetts | May | July–September | October | High | 2024 EEE: 4 cases [3]; first EEE death 2024 [3] |
| Michigan | May | June–August | September–October | Moderate | 2024 WNV: 31 cases [3] |
| Minnesota | May | June–August | September | Moderate–High | 2024 WNV: 35 cases per MN DOH [14] |
| Mississippi | March | June–September | November | Very High | 2024 WNV: 59 cases [3]; subtropical climate |
| Missouri | April | June–August | October | Moderate–High | 2024 WNV: 13 cases [3] |
| Montana | May–June | July–August | September | Low–Moderate | 2024 WNV: 4 cases [3] |
| Nebraska | April–May | June–September | October | High | 2024 WNV: 92 cases [3]; 4th highest nationally |
| Nevada | March–April | June–September | October | Moderate | 2024 WNV: 27 cases [3] |
| New Hampshire | May–June | July–August | October | Moderate–High | 2024 EEE: 5 cases, 2 deaths [3]; highest EEE burden in 2024 |
| New Jersey | April–May | July–August | October | Moderate–High | 2024 WNV: 39 cases; EEE 2 cases [3] |
| New Mexico | April–May | July–September | October | Moderate | 2024 WNV: 28 cases [3] |
| New York | May | July–August | October | Moderate–High | 2024 WNV: 98 cases; EEE 2 cases (first human case since 2015) [3] |
| North Carolina | March–April | June–September | November | High | 2024 WNV: 26 cases; EEE 1 case [3] |
| North Dakota | May–June | July–August | September | Moderate | 2024 WNV: 38 cases [3] |
| Ohio | April–May | July–August | October | Moderate–High | 2024 WNV: 14 cases [3] |
| Oklahoma | March–April | June–September | November | High | 2024 WNV: 39 cases [3] |
| Oregon | May | June–August | October | Low–Moderate | Low WNV burden; 2024 WNV: 0 cases in ArboNET table [3] |
| Pennsylvania | April–May | July–August | October | High | 2024 WNV: 61 cases [3]; 6th highest nationally |
| Rhode Island | May | July–August | October | Moderate | 2024 EEE: 1 case [3]; WNV: 6 cases |
| South Carolina | March | June–September | November | High | 2024 WNV: 18 cases [3]; subtropical wetlands |
| South Dakota | May | July–August | September | Moderate | 2024 WNV: 21 cases [3] |
| Tennessee | March–April | June–August | November | High | 2024 WNV: 9 cases [3]; Ae. albopictus expanding |
| Texas | February (S. TX) | May–October | December (S. TX) | Very High | 2024 WNV: 176 cases — leads all states [3]; local dengue 2024 [15] |
| Utah | April–May | July–August | September–October | Moderate | 2024 WNV: 14 cases; all neuroinvasive [3] |
| Vermont | May–June | July–August | October | Moderate | 2024 EEE: 2 cases, 1 death [3] |
| Virginia | April | June–August | October | Moderate–High | 2024 WNV: 10 cases [3] |
| Washington | May | June–August | October | Low–Moderate | 2024 WNV: 1 case [3] |
| West Virginia | April–May | July–August | October | Low–Moderate | 2024 WNV: 2 cases [3] |
| Wisconsin | May | June–August | September | Moderate | 2024 WNV: 34 cases; EEE 1 case [3] |
| Wyoming | May–June | July–August | September | Low–Moderate | 2024 WNV: 2 cases [3] |
Sources: CDC ArboNET 2024 provisional data (as of Jan 16, 2026) [3]; CDC seasonal surveillance patterns [2]; MN Dept. of Health [14]; Climate Central [9]. WNV case counts are from ArboNET 2024 provisional table.
8. Climate Change & Mosquito Trends
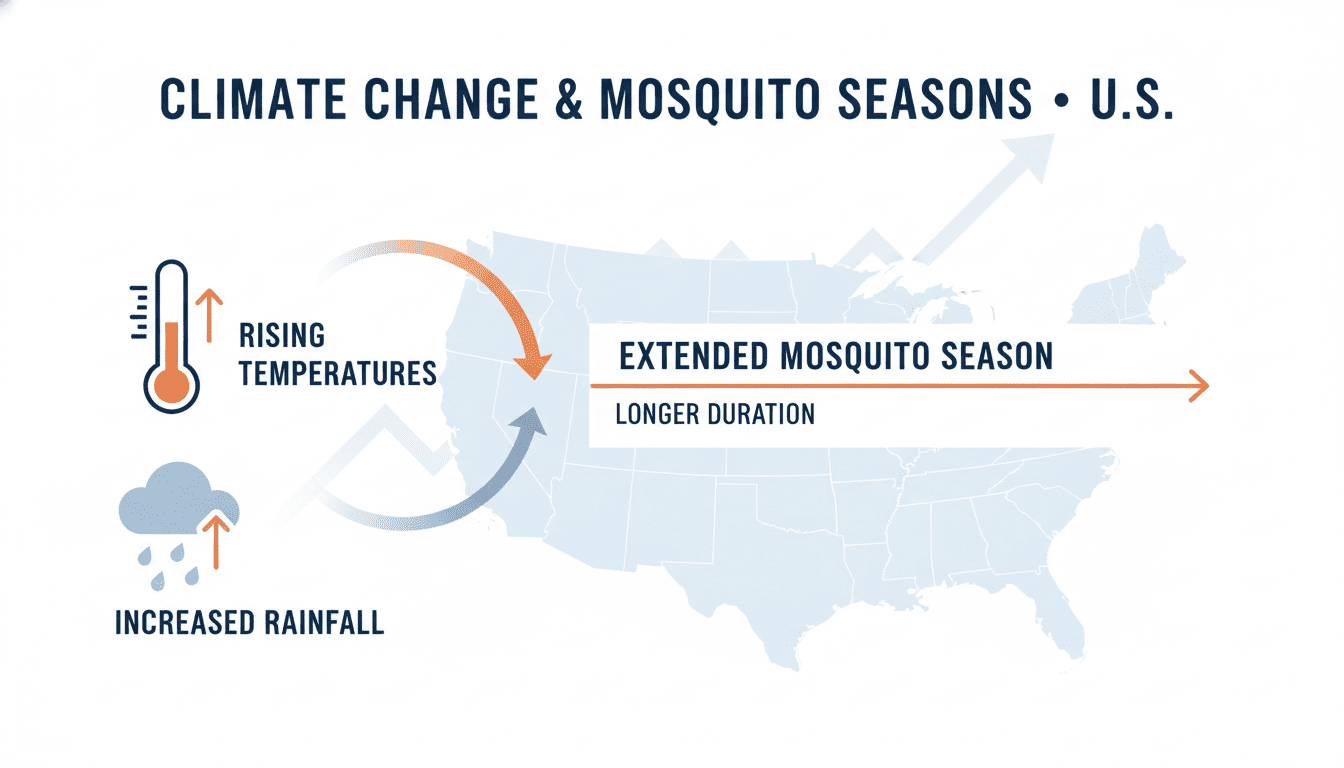
Warming temperatures and shifting precipitation patterns are altering when and where mosquitoes can survive and breed in the United States. Climate Central’s peer-reviewed analysis (published Washington Post, August 22, 2024) found that more than two-thirds of the contiguous U.S. experienced an increase in ‘mosquito days’ — defined as days with average relative humidity at or above 42% and temperatures between 50°F and 95°F — over the past four decades [9].
Published climate modeling projects that warming autumns and earlier springs could extend the U.S. mosquito season by up to two months by 2050 [11]. These trends have direct implications for US mosquito statistics 2026 and forward projections.
8.1 Trend Comparison Table
| Period | U.S. Avg. Temp Change (vs. pre-industrial baseline) | Observed Mosquito Season Change | Documented Disease / Vector Impact |
| 1980–2009 (reference baseline) | Approx. +0.8°C vs. pre-industrial (IPCC AR6 [17]) | Reference baseline for mosquito-day analysis [9] | WNV introduced to U.S. 1999; malaria absent locally since 1970s; Ae. albopictus range expanding |
| 2010–2015 | Approx. +1.0°C vs. pre-industrial (IPCC AR6 [17]) | Modest early-season expansion in mid-latitudes documented in surveillance data [9] | Ae. albopictus continues northward range expansion; sporadic dengue local cases in FL and TX |
| 2016–2020 | Approx. +1.1–1.2°C vs. pre-industrial (IPCC AR6 [17]) | Northeast cities show 10–17 more mosquito days than 1980-2009 baseline in some locations [9] | EEE outbreak 2019 (38 cases, highest on record per CDC [8]). First locally acquired dengue in CA confirmed. |
| 2021–2024 | Approx. +1.2–1.3°C vs. pre-industrial (estimated per IPCC AR6 trajectory [17]) | Vermont and other Northeast states gaining 15–17 additional mosquito-suitable days vs. baseline [9] | Local dengue transmission confirmed in CA, AZ, NC, and FL 2024 [15]. EEE above average in 2024 New England (13 of 19 cases) [3]. WNV 2025 above-average season [4]. |
| Projected 2026 Estimate | Continued warming expected under all IPCC scenarios | Further season lengthening in Northeast and Pacific Northwest; possible heat-induced summer compression in extreme desert Southwest | Projected: Expanded Ae. aegypti and Ae. albopictus ranges; rising locally acquired dengue risk; EEE cycle watch [16] |
| Projected 2050 (long-term) | +1.5°C minimum under low-emission IPCC scenarios; up to +3°C under high-emission scenarios [17] | Published modeling projects U.S. mosquito season potentially 1–2 months longer [11] | Harvard Gazette (Oct 2024) reports substantially increased geographic range for dengue and WNV under continued warming. Malaria local transmission theoretically possible in more areas but public health infrastructure remains a strong barrier [11]. |
8.2 Mechanisms of Climate-Mosquito Interaction
Published vector ecology research from the University at Albany (September 2024) identifies the key mechanisms through which climate change is influencing U.S. mosquito populations and disease risk:
(1) expanded geographic range of Ae. aegypti and Ae. albopictus into higher latitudes as temperatures become thermally suitable, driving the first locally acquired dengue cases in CA, AZ, NC, and FL in recent years [16];
(2) accelerated mosquito life cycles leading to shorter mosquito lifespan due to higher ambient temperatures, shortening intervals between blood meals and egg-laying;
(3) longer transmission seasons resulting from milder winters and earlier springs [9]; and
(4) increased availability of larval habitat following intensified precipitation events [17].
9. Urban vs. Rural Mosquito Trends
Mosquito ecology and disease risk differ substantially between urban and rural environments. No single federal database maintains standardized national urban/rural mosquito density comparisons; the patterns below are documented in CDC vector surveillance literature and peer-reviewed entomological research. Figures in this section are qualitative unless otherwise cited.
| Factor | Urban Settings | Rural Settings | Public Health Implication |
| Dominant Species | Culex pipiens; Aedes albopictus (container-breeding); peridomestic species adapted to urban water sources | Culex tarsalis (agricultural/plains); Aedes vexans (floodwater); Anopheles spp. (freshwater wetlands) | Urban environments favor Aedes-vectored disease risk (dengue, Zika); rural settings favor WNV and EEE vector exposure |
| Primary Breeding Sites | Containers (birdbaths, clogged gutters, catch basins, tires, storm drains, flower pots) | Natural wetlands, rice fields, irrigation ditches, floodplain pools, livestock troughs, marshes | Urban breeding is highly controllable through source-reduction campaigns; rural breeding often requires organized abatement programs |
| WNV Exposure | High: Culex pipiens bites humans in dense urban environments; 2024 top WNV states include CA (123) and NY (98) — major urban centers [3] | High: Culex tarsalis is a highly efficient WNV vector in agricultural plains; NE (92 cases, 2024) demonstrates rural burden [3] | WNV burden is documented in both urban and rural states; no clear geographic preference by case count |
| EEE Risk | Low: Culiseta melanura prefers freshwater hardwood swamps, largely absent from urbanized areas | High in specific habitats: wooded swamp margins and rural residential areas near endemic swamps in MA, NH, NY, NJ, VT, ME, WI [3] | EEE is primarily a rural/suburban risk; 2024 cases concentrated near freshwater hardwood swamp habitats [3][13] |
| Dengue Risk | Higher: Ae. aegypti is strongly peridomestic, thriving in dense housing with container water; local dengue 2024 in urban FL, TX, CA [15] | Lower overall, except near Ae. albopictus habitat adjacent to human dwellings | Local dengue transmission risk concentrated in urban/suburban environments with established Ae. aegypti populations |
| Vector Control Access | Greater access to municipal abatement programs, professional pest control services, public education campaigns | Less consistent access to organized vector control; higher reliance on personal protective measures | Resource disparities can elevate per-capita disease risk in rural communities; EPA and AMCA recommend IVM programs at county level [1][13] |
| Urban Heat Island Effect | Elevated local temperatures can extend mosquito activity 2–4 weeks beyond regional seasonal average [9] | Temperature generally tracks regional climate averages without amplification | Urban heat islands identified by Climate Central analysis as a factor extending WNV and Aedes activity in major metro areas [9] |
Sources: CDC [2][3][12]; EPA [13]; University at Albany vector ecology research [16]; Climate Central [9]. Urban/rural density comparisons are qualitative due to absence of a unified national urban-rural mosquito density database.
10. Economic Impact of Mosquito Control in the U.S.
| Economic Category | Estimated Value / Metric | Data Year | Source |
| Total U.S. mosquito control market | $1,873.4 million (~$1.87 billion) | 2024 | Precision Business Insights [10] |
| Projected U.S. mosquito control market (2031) | $2,911.2 million (~$2.91 billion) at CAGR of 6.5% | Projected | Precision Business Insights [10] |
| U.S. mosquito repellent market | $1,533.3 million (~$1.53 billion) | 2024 | IMARC Group [18] |
| U.S. mosquito repellent market projected (2033) | $3,039.7 million at CAGR of 7.9% | Projected | IMARC Group [18] |
| North America insect repellent market | $1.6 billion | 2023 | Grand View Research [19] |
| Total U.S. structural pest control revenue (all pests) | $12.654 billion (up 7.9% from 2023) | 2024 | Specialty Consultants LLC / NPMA [20] |
| U.S. mosquito repellent share of insect repellent market | 50.7% (by revenue) | 2024 | Grand View Research [19] |
| Pest control product expenditures (all categories) | Exceeded $1 billion for first time; up 8.9% from 2023 | 2024 | Specialty Consultants LLC / NPMA [20] |
| Healthcare costs of U.S. mosquito-borne diseases | Data not publicly available in consolidated form | — | No single federal source provides this figure |
The economic footprint of mosquito activity extends beyond direct control spending to include lost outdoor workforce productivity, tourism impacts in peak-activity seasons, and the costs of diagnosing and treating mosquito-borne illness. A consolidated U.S.-specific disease healthcare cost estimate was not identified in publicly available federal data sources as of this report’s compilation date.
Commercial market estimates cited above carry methodological variance; figures from different research firms for the same market category may differ materially, as shown by the repellent market where estimates range from $1.53B (IMARC) to $1.6B (Grand View North America). These should be interpreted as directional market size estimates, not precise official statistics.
11. Prevention & Control Methods
The following table presents mosquito prevention and control methods used in the United States, ranked by documented CDC recommendation priority, evidence of effectiveness, and adoption in public health programs. Rankings reflect CDC and EPA guidance as of the report’s publication date.
| Rank | Method | Mechanism | CDC/EPA Status | Trend |
| 1 | EPA-registered insect repellents (DEET, Picaridin, IR3535, OLE/PMD, 2-Undecanone) | Chemical deterrence of biting; disrupts host-detection by mosquitoes | CDC primary personal protection recommendation [12] | Stable; growing preference for DEET-free options (Picaridin, PMD) per market data [18] |
| 2 | Elimination of standing water (source reduction) | Destroys larval breeding habitat; prevents eggs hatching to adults | Cornerstone of Integrated Vector Management (IVM); endorsed by CDC and EPA [13] | Stable; community campaigns, ordinance enforcement increasingly common |
| 3 | Larviciding (Bacillus thuringiensis israelensis [Bti], methoprene) | Biological/chemical agents kill larvae in standing water before adult emergence | EPA-registered; preferred for low environmental impact [13] | Increasing: Bti preferred for reduced non-target effects; drone applications expanding |
| 4 | Permethrin-treated clothing and gear | Contact insecticide applied to fabrics; kills or repels mosquitoes on contact with clothing | CDC-recommended, especially for outdoor workers, military, travelers [12] | Increasing adoption; commercially pre-treated garments now widely available |
| 5 | Adulticiding (ULV truck/aerial spraying with pyrethroids or organophosphates) | Ultra-low volume insecticide mist applied to kill adult mosquitoes; deployed during outbreaks | EPA-registered; CDC-endorsed for outbreak control scenarios [13] | Stable; public preference shifting toward targeted application over broad-area spraying |
| 6 | Window and door screens; air conditioning | Physical barriers prevent mosquito entry into living spaces | Passive but highly effective; implicit in CDC vector avoidance guidance [12] | Stable; standard in most U.S. housing stock |
| 7 | Biological control (Gambusia fish, Bti, Bacillus sphaericus) | Natural predators and microbial agents reduce larval populations in water bodies | Endorsed for environmentally sensitive areas [13] | Increasing: preferred method in wetland and natural area management contexts |
| 8 | Genetically modified mosquito releases (Oxitec Friendly Aedes technology) | GM males produce offspring that die before reproducing, reducing wild Ae. aegypti populations | EPA has approved field release trials in FL and CA [13] | Emerging; limited scale; public acceptance variable; ongoing EPA-monitored trials |
| 9 | Mosquito surveillance traps (gravid traps, CO2 traps, BG-Sentinel) | Traps used for vector monitoring and disease surveillance; secondarily for control | Recommended by CDC and AMCA for surveillance programs [1][12] | Stable for surveillance; consumer control traps have limited proven population-level efficacy |
| 10 | Integrated Vector Management (IVM) programs (community-wide) | Coordinated multi-strategy approach: source reduction, larviciding, adulticiding, public education | CDC and WHO gold standard for sustained community-level mosquito control [1][13] | Growing: state and county vector control programs increasingly formalizing IVM frameworks |
Note: Ultrasonic electronic mosquito repellent devices are NOT included because published evidence does not support their effectiveness; the American Mosquito Control Association explicitly states they provide no meaningful protection [1]. Sources: CDC [1][12]; EPA [13]; AMCA [1].
12. Methodology
12.1 Data Sources Used
This report draws exclusively on primary government surveillance data, peer-reviewed publications, and published market research. No secondary aggregators, forums, or unattributed online content were used as data sources. All figures that appear as confirmed data have a numbered citation traceable to a specific document.
- CDC ArboNET System: Primary source for all human mosquito-borne disease case counts. 2024 data: provisional, current as of January 16, 2026. 2025 data: provisional as of January 13-14, 2026. Both datasets are subject to revision. Direct PDF source for state-level 2024 ArboNET table obtained from California West Nile Virus Website, distributing CDC ArboNET document [3].
- CDC Morbidity and Mortality Weekly Report (MMWR): Padda H, Jacobs D, Gould CV, et al. ‘West Nile Virus and Other Nationally Notifiable Arboviral Diseases — United States, 2023.’ MMWR 2025;74:358-364. Used for long-run average case counts and the 2023 season summary [2].
- CDC MMWR: Ware-Gilmore F, et al. ‘Dengue Outbreak and Response — Puerto Rico, 2024.’ MMWR 2025;74:54-60. Used for confirmed Puerto Rico dengue 2024 case counts, hospitalizations, and deaths [6].
- CDC Health Alert Network (HAN-00523): ‘Ongoing Risk of Dengue Virus Infections and Updated Testing Recommendations in the United States.’ March 2025. Used for 2025 dengue activity updates and the operational death toll figure of 13 [7].
- American Medical Association (AMA): AMA-CDC joint webinar summary, December 5, 2025, with Dr. Erica Kaufman West, AMA infectious-diseases director. Used for 2025 WNV severity metrics (41% more severe cases; 32% more deaths) [4].
- Vax-Before-Travel: Report citing CDC data showing over 2,000 WNV cases as of December 17, 2025, with Colorado at 284 cases [5].
- CDC Current Dengue Outbreak page: Used for 2025 Puerto Rico outbreak extension, USVI ongoing outbreak, and American Samoa July 2025 outbreak declaration [15].
- Utah DHHS 2024 Mosquito-Borne Disease Annual Report: Provided 2024 WNV national case count (1,791) derived from CDC ArboNET, and comparative state-level data [3-Utah].
- Minnesota Department of Health: 2024 WNV Minnesota statistics confirming 35 cases [14].
- EPA: General Information about Mosquitoes (Updated July 10, 2025); EEE Surveillance and Control Guidelines. Used for vector control method endorsements and species biology [13].
- American Mosquito Control Association (AMCA): Species count (176), general biology, control method information [1].
- IPCC Sixth Assessment Report (AR6): Temperature change baselines for climate comparison table [17].
- Climate Central analysis (Stevens, Washington Post, August 22, 2024): Mosquito day increase data by region and city [9].
- Harvard Gazette (October 16, 2024): Climate-mosquito disease projection to 2050 [11].
- University at Albany vector ecology research (September 23, 2024): Range expansion mechanisms for Ae. aegypti and Ae. albopictus [16].
- Market Research: Precision Business Insights (USA mosquito control market) [10]; IMARC Group (U.S. mosquito repellent market) [18]; Grand View Research (North America insect repellent) [19]; Specialty Consultants LLC / NPMA (total pest control revenue) [20].
- NCBI StatPearls (December 2025): EEE case fatality rate ranges [21].
12.2 Compilation Method
Data were compiled through systematic review of publicly available federal surveillance databases, peer-reviewed publications (accessed via PubMed/PMC and MMWR), and government health authority documents.
All cited figures were cross-referenced against primary source documentation. Where multiple sources reported the same metric with variation, the most recent official federal source (CDC MMWR or ArboNET) was prioritized as the authoritative value. Secondary commercial market estimates were used only for economic data unavailable from federal sources, and are identified as such.
12.3 Limitations
- Under-reporting: All mosquito-borne disease case counts substantially underestimate true incidence. Approximately 80% of WNV infections are asymptomatic. Only about 1 in 150 WNV infections results in neuroinvasive disease [2]. Non-neuroinvasive illness is significantly underreported.
- Reporting lag: 2024 ArboNET data (as of January 16, 2026) are still labeled preliminary and subject to change. Final 2025 annual totals are not yet available.
- No standardized national bite rate: Per-capita mosquito bite rates are not collected by any federal agency. Bite risk levels in Section 4 are qualitative composites, not measured data.
- Market data variance: Commercial market research estimates vary by firm methodology; the U.S. mosquito repellent market is estimated variously at $1.09B–$1.53B depending on geographic scope and product definition. All figures are noted with their source and should be interpreted as directional estimates.
- State season timings: Represent regional averages; local variation by elevation, microclimate, and land use can shift actual timing by several weeks. No single federal dataset publishes state-by-state mosquito season start/end dates.
- Density ratings: Population density levels in Section 3 are qualitative assessments not derived from a standardized federal measurement system.
12.4 Projection Explanation
All entries labeled ‘Projected 2026 Estimate’ are forward-looking assessments based on:
- confirmed trajectory of observed data through early 2026;
- published climate modeling for mosquito range expansion (University at Albany [16]; Harvard Gazette [11]);
- established epidemiological cyclical patterns (EEE 5-8 year cycle, per CDC historical data [8]); and
- market growth modeling from industry research firms.
Projections do not represent confirmed outcomes and should be interpreted as directional estimates carrying substantial uncertainty. They are clearly distinguished from confirmed data throughout this report.
Frequently Asked Questions (FAQs)
Which is the most common mosquito-borne disease in the United States?
West Nile virus (WNV) is the leading cause of mosquito-borne disease in the contiguous United States, accounting for approximately 95% of all nationally notifiable domestic arboviral disease cases in 2023 [2]. The CDC MMWR (2025) reports that WNV causes an average of approximately 2,000 disease cases annually, including approximately 1,200 neuroinvasive cases and 120 deaths [2].
In 2024, 1,791 total human WNV cases were reported to ArboNET, with 161 deaths [3].
In 2025, an AMA-CDC joint report confirmed the season was above average: 41% more severe cases and 32% more deaths than the typical annual baseline [4].
When is mosquito season in the United States?
Mosquito season varies significantly by region and is not formally defined by a single federal calendar. In southern states like Florida, Louisiana, and Texas, activity can begin as early as February and extend into December or beyond. In northern states, meaningful mosquito activity typically begins in May-June and ends by October following the first hard frost.
Climate Central’s published analysis (reported Washington Post, August 22, 2024) found that more than two-thirds of the contiguous U.S. experienced an increase in ‘mosquito days’ compared to the 1980-2009 baseline period, with some northeastern cities experiencing 13-17 additional mosquito-suitable days in recent years [9].
Is dengue fever a risk in the United States?
Dengue is primarily a risk in U.S. territories. Puerto Rico declared a public health emergency in March 2024 and reported 6,291 confirmed cases that year, with 52.3% hospitalized, and 11-13 fatalities (11 per MMWR [6]; 13 per CDC HAN-00523 [7] as a running operational total). As of March 7, 2025, cases in Puerto Rico were running 113% above the same period in 2024 [7], and the outbreak declaration was extended through December 2025 [15].
In the continental United States, dengue cases are mostly travel-associated, but local transmission has been confirmed in Florida, Texas, California, and Arizona in recent years [15]. Global dengue surged in 2024 to 13 million cases in the Americas, substantially elevating travel-associated risk for U.S. residents [6].
How does climate change affect mosquito populations in the US?
Published vector ecology research from the University at Albany (September 2024) attributes the northward expansion of Ae. aegypti and Ae. albopictus to warming temperatures, which is driving first-ever locally acquired dengue cases in California, Arizona, North Carolina, and Florida over the last five years [16]. Climate Central’s published analysis found that more than two-thirds of the contiguous U.S. has experienced more mosquito-suitable days compared to the 1980-2009 baseline, with the Northeast seeing the fastest increases [9].
Harvard Gazette reporting (October 2024) on published climate-disease modeling projects substantially increased geographic range for dengue and WNV under continued warming, with some models estimating the U.S. mosquito season could be up to two months longer by 2050 [11].
What mosquito bite prevention methods does the CDC recommend?
The CDC recommends a layered personal protection approach. For individual protection, the primary recommendation is applying an EPA-registered insect repellent containing one of five active ingredients: DEET, Picaridin, IR3535, Oil of Lemon Eucalyptus (OLE)/para-menthane-diol (PMD), or 2-Undecanone [12]. The CDC also recommends wearing loose-fitting long-sleeved clothing, using permethrin-treated garments for extended outdoor exposure, and using window and door screens [12].
At the household level, eliminating standing water is the cornerstone of the CDC’s source-reduction guidance [13]. The American Mosquito Control Association explicitly states that ultrasonic electronic repellent devices provide no meaningful protection from mosquitoes and are not recommended [1].
References
[1] American Mosquito Control Association (AMCA). Mosquito Information: Species and Biology. Available at: https://www.mosquito.org/mosquito-information/. Accessed February 2026.
[2] Padda H, Jacobs D, Gould CV, et al. West Nile Virus and Other Nationally Notifiable Arboviral Diseases — United States, 2023. MMWR Morb Mortal Wkly Rep 2025;74:358–364. DOI: http://dx.doi.org/10.15585/mmwr.mm7421a1. Available at: https://www.cdc.gov/mmwr/volumes/74/wr/mm7421a1.htm. Published June 12, 2025.
[3] CDC ArboNET. West Nile Virus and other nationally notifiable arboviruses — United States, 2024. Provisional data as of January 14-16, 2026. State-level tabular data distributed by California West Nile Virus Website: https://westnile.ca.gov/download?download_id=5083. Also available: CDC Historic Data (1999-2024) dashboard: https://www.cdc.gov/west-nile-virus/data-maps/historic-data.html.
[4] American Medical Association (AMA). West Nile Virus Deaths Up by 32% in 2025. December 5, 2025. Available at: https://www.ama-assn.org/public-health/infectious-diseases/west-nile-virus-deaths-32-2025. Quoting: Dr. Erica Kaufman West, AMA Infectious Diseases Director, AMA-CDC Joint Webinar.
[5] Vax-Before-Travel. West Nile Virus Causes Deaths Throughout Europe and the USA. December 17, 2025. Available at: https://www.vax-before-travel.com/2025/12/17/west-nile-virus-causes-deaths-throughout-europe-and-usa. (Citing CDC data as of December 17, 2025.)
[6] Ware-Gilmore F, Rodriguez DM, Ryff K, et al. Dengue Outbreak and Response — Puerto Rico, 2024. MMWR Morb Mortal Wkly Rep 2025;74:54–60. DOI: 10.15585/mmwr.mm7405a1. Published February 20, 2025. Available at: https://www.cdc.gov/mmwr/volumes/74/wr/mm7405a1.htm.
[7] Centers for Disease Control and Prevention (CDC). Health Alert Network (HAN-00523): Ongoing Risk of Dengue Virus Infections and Updated Testing Recommendations in the United States. March 2025. Available at: https://www.cdc.gov/han/php/notices/han00523.html.
[8] Centers for Disease Control and Prevention (CDC). Data and Maps for Eastern Equine Encephalitis. Available at: https://www.cdc.gov/eastern-equine-encephalitis/data-maps/index.html. Accessed February 2026. (‘On average, 11 cases of eastern equine encephalitis virus disease are reported annually in the U.S.’)
[9] Stevens H. Mosquito Season Is Changing. See If It Has Gotten Longer in Your Area. Washington Post (Climate Central analysis). August 22, 2024. Available at: https://www.washingtonpost.com/climate-environment/interactive/2024/mosquito-season-state-change-global-warming/.
[10] Precision Business Insights. USA Mosquito Control Market Outlook, Size, Share Analysis 2030. Market value: $1,873.4M (2024); projected $2,911.2M (2031); CAGR 6.5%. Available at: https://www.precisionbusinessinsights.com/market-reports/usa-mosquito-control-market. Accessed February 2026.
[11] Harvard Gazette. Threat of Mosquito-Borne Diseases Rises with Global Temperature. October 16, 2024. Available at: https://news.harvard.edu/gazette/story/2024/10/threat-of-mosquito-borne-diseases-rises-with-global-temperature/. (Reporting on published peer-reviewed climate-disease modeling research.)
[12] Centers for Disease Control and Prevention (CDC). About Mosquitoes in the United States. Updated June 4, 2024. Available at: https://www.cdc.gov/mosquitoes/about/about-mosquitoes-in-the-united-states.html.
[13] U.S. Environmental Protection Agency (EPA). General Information about Mosquitoes. Updated July 10, 2025. Available at: https://www.epa.gov/mosquitocontrol/general-information-about-mosquitoes. Also: EPA EEE Surveillance and Control Guidelines, September 2024.
[14] Minnesota Department of Health. West Nile Virus Maps and Statistics. 2024 data (‘In 2024, 35 WNV disease cases were reported in Minnesota’). Available at: https://www.health.state.mn.us/diseases/westnile/statistics.html. Accessed February 2026.
[15] Centers for Disease Control and Prevention (CDC). Current Dengue Outbreak Information. Updated 2025. Available at: https://www.cdc.gov/dengue/outbreaks/2024/index.html. (Cites PR outbreak extension through Dec 2025; USVI; American Samoa outbreak July 7, 2025; local transmission in FL, TX, CA 2024; FL 2025.)
[16] University at Albany. Q&A: The Intersection of Mosquito-Borne Disease and Climate Change. September 23, 2024. Available at: https://www.albany.edu/news-center/news/2024-qa-intersection-mosquito-borne-disease-and-climate-change.
[17] Intergovernmental Panel on Climate Change (IPCC). Sixth Assessment Report (AR6), Working Group I: The Physical Science Basis. 2021. Available at: https://www.ipcc.ch/report/ar6/wg1/. (Temperature change baselines referenced in Section 8.)
[18] IMARC Group. United States Mosquito Repellent Market: Industry Trends, Share, Size, Growth, Opportunity and Forecast 2025-2033. Market value: $1,533.3M (2024); projected $3,039.7M (2033); CAGR 7.9%. Available at: https://www.imarcgroup.com/united-states-mosquito-repellent-market. Accessed February 2026.
[19] Grand View Research. North America Mosquito Repellent Market Size & Share Analysis 2024-2030. Market value: $1.6B (North America, 2023); U.S. insect repellent market: $376.9M (2024). Available at: https://www.grandviewresearch.com/industry-analysis/north-america-mosquito-repellent-market. Accessed February 2026.
[20] National Pest Management Association (NPMA) / Specialty Consultants LLC. U.S. Pest Control Industry Shows Remarkable Resilience with Nearly 8% Growth in 2024. Total structural pest control revenue: $12.654 billion (2024). Available at: https://www.npmapestworld.org/. Accessed February 2026.
[21] Wormsbecker A, Weatherhead JE. Eastern Equine Encephalitis. StatPearls [Internet]. Treasure Island (FL): StatPearls Publishing. Updated December 14, 2025. Available at: https://www.ncbi.nlm.nih.gov/sites/books/NBK557692/. (EEE case fatality rate: approximately 30-40%, with reports as high as 41%.)