Table of Contents
1. Executive Summary
This guide compiles the most current publicly available U.S. climate and mosquito surveillance data to characterize mosquito season timing, peak activity months, humidity conditions, and prevention windows for all 50 states. Season timings are derived from NOAA 1991-2020 Climate Normals [1], Climate Central mosquito-suitability modeling [2], and CDC ArboNET vector-borne disease surveillance [3]. All confirmed data are cited. Forward-looking estimates for mosquito season 2026 are clearly labeled as projections.
1.1 Key National Mosquito Season Patterns
- Mosquito season by state ranges from year-round activity in Hawaii and South Florida to a window of approximately 6–8 weeks in Alaska [1][2].
- Nationally, the season defined by mosquito-suitable conditions — temperatures between 50-95°F and average relative humidity at or above 42% — spans an average of 116 to 210 days across the contiguous United States, depending on region [2].
- The Southeast and Gulf Coast experience the longest mosquito seasons in the contiguous U.S., with over 200 suitable days per year in some locations [2].
- The Northeast and Midwest have seen the largest regional increases in annual mosquito-suitable days since 1979. The Ohio Valley and Northeast added more mosquito-suitable days over this period than any other region [2].
- Peak mosquito months nationally are July and August, when temperatures, humidity, and standing water conditions are simultaneously optimal for all life stages [3][4].
- Projected 2026 Estimate: Based on documented climate trends, the 2026 season is expected to continue the pattern of earlier spring onset in southern states and continued season lengthening in the Northeast, consistent with multi-year NOAA temperature-trend data [1][5].
1.2 Regional Season Overview
| Region | Typical Season | Avg. Suitable Days/Yr | Peak Risk Months | Key Climate Driver |
| Southeast | Feb–Nov (year-round in S. FL) | >200 days [2] | June–September | High humidity, subtropical heat, rainfall |
| Gulf Coast | Feb–Dec | >190 days [2] | May–October | Tropical humidity, storm water accumulation |
| Mid-Atlantic | April–October | ~150–170 days [2] | July–August | Warm humid summers, coastal wetlands |
| Midwest | May–September | ~130–160 days [2] | July–August | Agricultural landscape, summer rainfall |
| Great Plains | April–October | ~120–155 days [2] | July–August | Irrigation, warm summers, migratory birds |
| Northeast | May–October | ~120–150 days [2] | July–August | Season expanding; EEE swamp habitats |
| Southwest | March–November | ~100–160 days [2] | July–September | Monsoon season drives late-summer surge |
| West Coast | April–October | ~100–130 days [2] | June–September | Irrigation-dependent; Mediterranean climate |
| Mountain West | May–September | ~80–120 days [2] | July–August | Brief season; altitude limits activity |
| Hawaii / Territories | Year-round | 365 days [2] | Year-round | Tropical climate; no true dormant period |
Source: Climate Central mosquito-suitable day analysis [2]; CDC seasonal surveillance patterns [3]. ‘Suitable days’ = days with temperature 50-95°F and average relative humidity ≥42%.
1.3 Climate Influence Summary
Temperature is the primary determinant of mosquito season length. Mosquitoes become inactive when ambient temperatures drop consistently below 50°F (10°C), and most adult populations cannot survive hard freezes below 28°F (-2.2°C) [4][6]. The NOAA 1991-2020 Climate Normals confirm a warming trend of 0.16°F per decade across the contiguous United States since 1895 [1], which has translated directly into measurable expansion of mosquito-suitable conditions in multiple regions [2].
Humidity interacts with temperature to sustain or suppress mosquito populations between temperature events. Rainfall creates the standing water that is essential for larval development. Each of these three climate variables — temperature, humidity, and precipitation — is analyzed by state and region throughout this guide.
2. How Mosquito Season Is Determined
No single federal agency publishes a unified, official start and end date for mosquito season in each U.S. state. Season timing in this report is derived from a combination of temperature threshold analysis, NOAA climate normals, Climate Central suitability modeling, and CDC vector surveillance data. The following criteria and data sources inform the seasonal characterizations throughout this guide.
2.1 Temperature Thresholds
Mosquitoes are ectothermic (cold-blooded) insects whose metabolism, development rate, and flight activity are entirely governed by ambient temperature [6]. Published entomological thresholds, consistent across multiple peer-reviewed and public health sources, establish the following benchmarks:
| Temperature Threshold | Effect on Mosquitoes | Relevance to Season Timing |
| Below 50°F (10°C) | Mosquito activity ceases; metabolic processes too slow to sustain flight and host-seeking | Defines the effective lower bound of mosquito season; sustained periods below 50°F mark season end |
| 50–60°F (10–15°C) | Some adult activity possible; mosquitoes become lethargic; limited host-seeking | Transitional zone at season start and end; nuisance biting possible but disease transmission risk low |
| 60–70°F (15–21°C) | Moderate activity; breeding accelerates; host-seeking increases | Active season begins; source-reduction and larviciding recommended |
| 70–90°F (21–32°C) | Optimal range; peak flight activity, blood-feeding, and reproduction | Peak mosquito season; highest disease transmission risk; most prevention measures required |
| Above 95°F (35°C) | Activity declines due to heat stress and dehydration risk; mosquitoes seek shade | Brief suppression in desert Southwest during extreme heat; Culex still active near water |
| Below 28°F (-2.2°C) | Lethal to most adult mosquitoes; some cold-hardy eggs survive in frozen water | Hard freeze marks definitive season end in northern states; eggs persist to hatch in spring |
Sources: Central Massachusetts Mosquito Control Project [6]; peer-reviewed entomological review, PMC [7]; AMCA biology documentation [8].
2.2 Humidity Influence
Relative humidity is a critical secondary factor in mosquito survival and activity. Mosquitoes have a high surface-area-to-volume ratio and lose body moisture rapidly in dry conditions.
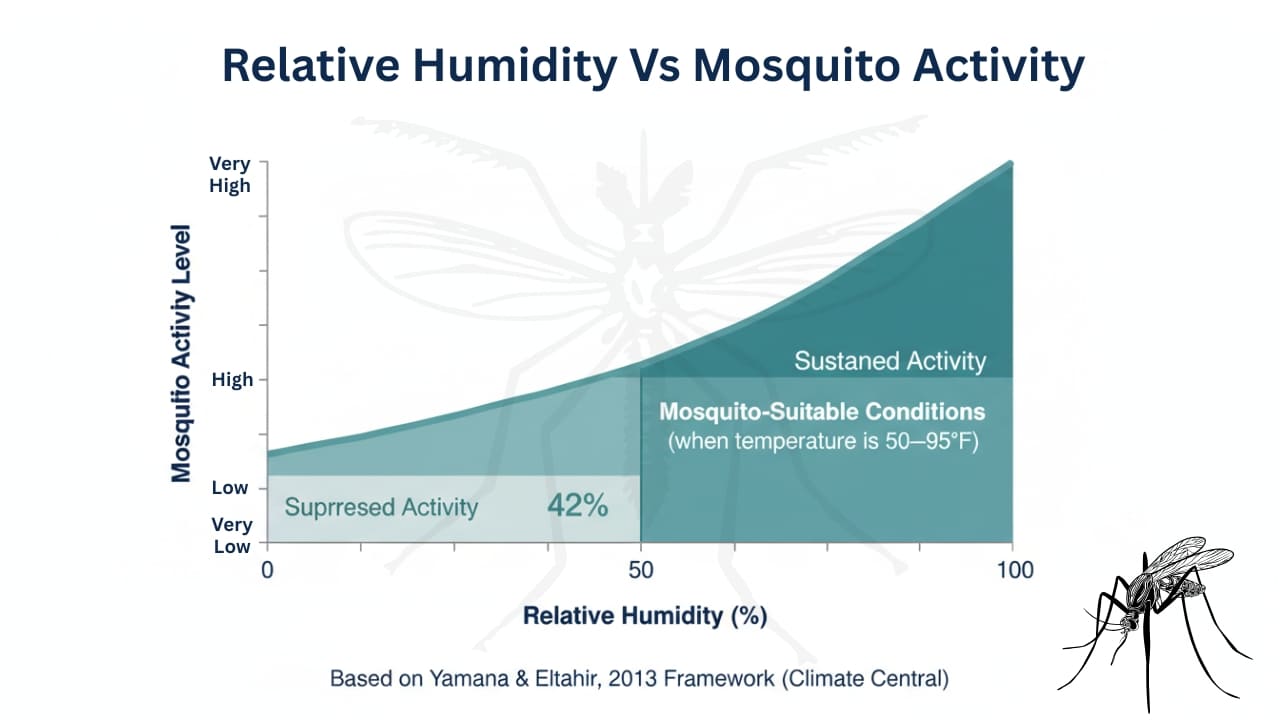
The Climate Central mosquito-suitability model — based on the Yamana and Eltahir (2013) framework — defines a mosquito-suitable day as one with both temperatures between 50-95°F and average relative humidity of 42% or greater [2]. Low humidity suppresses mosquito activity even when temperatures are otherwise favorable, which is why arid states like Nevada and Arizona have shorter effective seasons than their temperatures alone would suggest.
- High Humidity (generally above 60% avg. relative humidity): Sustained activity and survival; found in Southeast, Gulf Coast, Mid-Atlantic, Hawaii [1][2].
- Moderate Humidity (roughly 42–60% avg. relative humidity): Season active but shorter; applies to much of the Midwest, Great Plains, and Pacific Northwest [1][2].
- Low Humidity (generally below 42% avg. relative humidity): Suppresses mosquito activity even when temperatures are suitable; most common in the Mountain West and desert Southwest [1][2].
Note: Humidity categories in this report are qualitative regional characterizations derived from NOAA 1991-2020 Climate Normals. State-level relative humidity normals vary by season, location, and data station. Consult NOAA NCEI’s Climate Normals database for station-specific figures.
2.3 Rainfall Impact
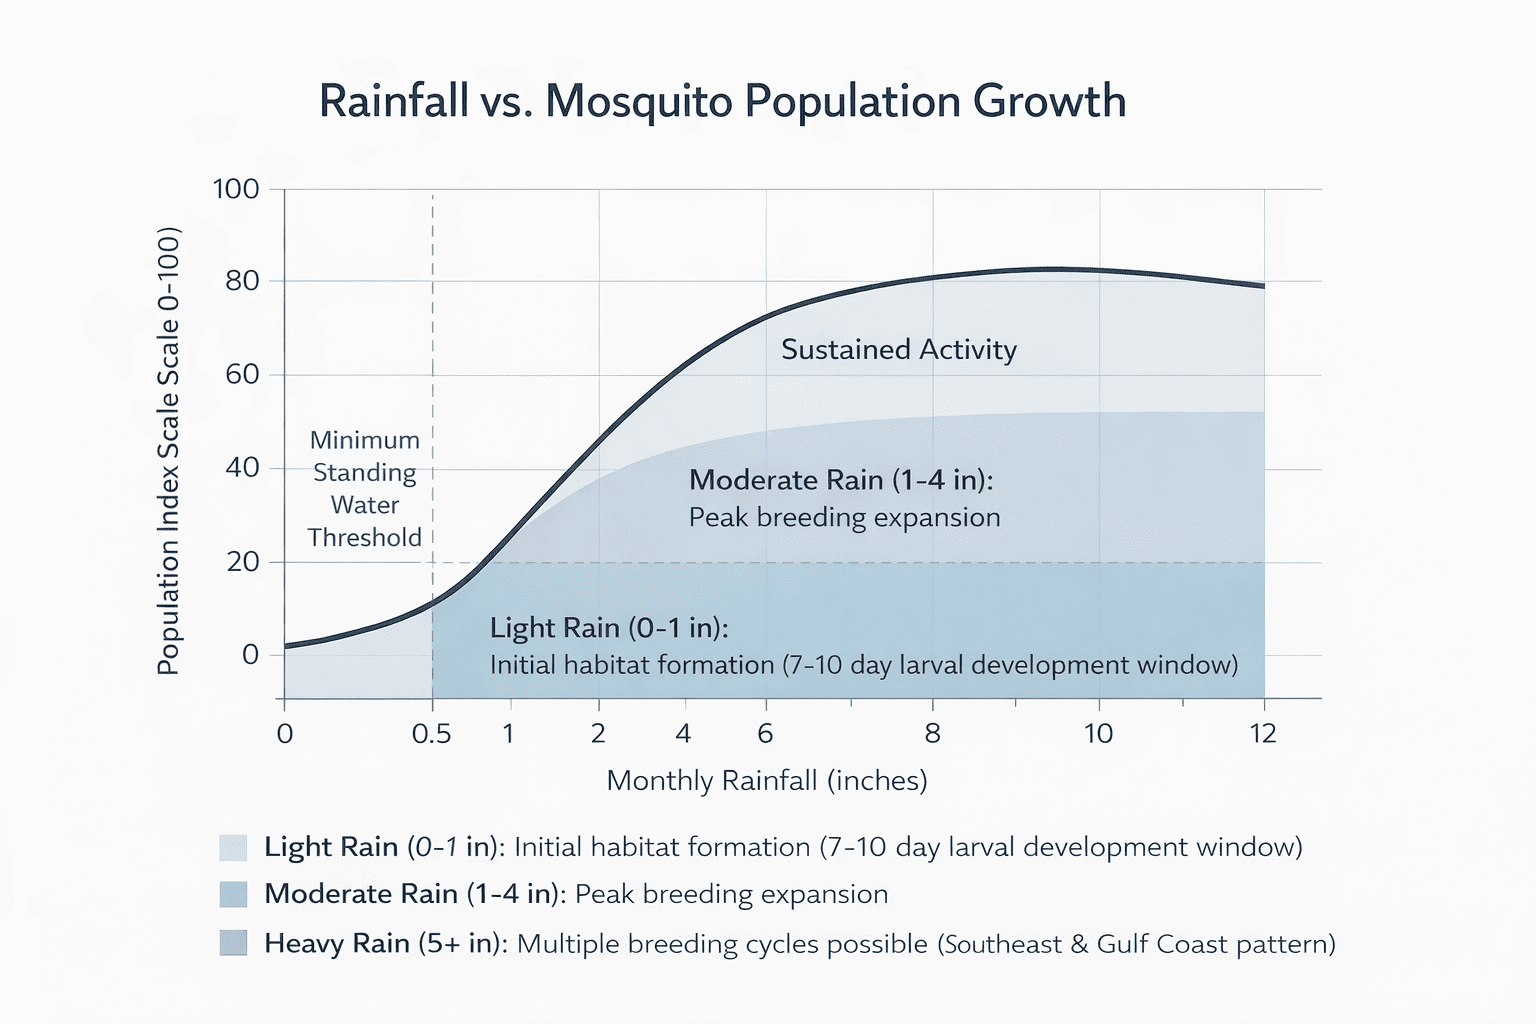
Rainfall is the primary driver of larval habitat creation. Female mosquitoes require standing water to lay eggs; larvae and pupae are entirely aquatic. Even modest rainfall events — as little as one-half inch — can create sufficient standing water in gutters, containers, depressions, and ditches to support substantial larval populations within 7–10 days at peak-season temperatures [8]. NOAA Climate Normals track monthly precipitation by state [1]; this guide uses those normals to characterize rainfall patterns by region.
- Heavy rainfall states (Southeast, Gulf Coast, Mid-Atlantic): Multiple breeding cycles possible after each significant rain event; larviciding cycles should follow weather forecasts.
- Monsoon-region states (AZ, NM, TX, NV): Pronounced late-summer mosquito surge driven by July-September monsoon precipitation [1].
- Drought-affected areas: Reduced standing water limits breeding, but irrigation infrastructure and storm-retention ponds compensate in agricultural regions.
2.4 Urban vs. Rural Factors
Mosquito season timing and intensity differs between urban and rural settings. Urban heat island effects — where densely built environments retain heat longer than surrounding rural areas — can extend mosquito activity by an estimated 2–4 weeks at the beginning and end of the season [2].
Impervious surfaces in cities increase stormwater runoff, but also create container-breeding habitat (catch basins, gutters, roof drains) that supports Culex pipiens and Aedes albopictus populations independent of natural rainfall patterns. Rural and agricultural settings support different species assemblages, primarily Culex tarsalis and floodwater Aedes species, whose population dynamics are more closely tied to natural precipitation cycles and irrigation schedules [3][8].
2.5 Data Sources Used in This Guide
| Source | Use in This Report | Reference |
| NOAA NCEI 1991-2020 U.S. Climate Normals | Baseline temperature and precipitation normals by state and region; season start/end timing calibration | [1] |
| Climate Central Mosquito Days Analysis (Yamana & Eltahir framework, 2023) | Mosquito-suitable day counts by region; trend data since 1979; humidity thresholds | [2] |
| CDC ArboNET Surveillance System | Vector-borne disease case timing; seasonal surveillance patterns; peak transmission month data | [3] |
| American Mosquito Control Association (AMCA) | Species biology; temperature thresholds; control method guidance | [8] |
| CDC — About Mosquitoes in the United States | Species distribution, vector biology, control recommendations | [4] |
| Peer-reviewed literature (PMC; Environmental Health Perspectives) | Temperature-mosquito biology review; Ae. aegypti and Ae. albopictus thermal thresholds | [7] |
| State health department surveillance calendars | State-specific season patterns and risk notes cited where available | [Various] |
| NOAA Climate.gov — Climate Change and 1991-2020 Normals | Context for observed warming trend; 0.16°F/decade national trend | [5] |
3. State-by-State Mosquito Season Guide — All 50 States
The following table provides state-level mosquito season timing, humidity characterization, and prevention timing recommendations for all 50 U.S. states. Season Start and Season End represent average timing under NOAA 1991-2020 Climate Normals [1]; actual timing in any given year may shift by 2–4 weeks depending on specific temperature and precipitation patterns.
Humidity Level is a qualitative regional classification derived from NOAA Climate Normals; it should not be interpreted as a precise measured relative humidity value. Prevention Timing represents the recommended action calendar for residential and community-level mosquito control.
Risk Level Key:
Very High = Year-round or near-year-round activity; history of multiple vector-borne disease reports; highest personal protection burden.
High = 8–10 month season; substantial disease surveillance activity; sustained prevention required.
Moderate–High = 6–8 month season; disease risk present; standard prevention protocols required.
Moderate = 5–7 month season; disease risk manageable; core prevention season June–August.
Low–Moderate = 4–6 month season; nuisance biting primary concern; brief intensive prevention window.
Low = Very short season; minimal vector-borne disease history; basic personal protection sufficient.
Year-Round = Continuous activity and transmission risk; no true dormant period.
| State | Season Start | Peak Months | Season End | Humidity Level | Prevention Timing | Risk Level |
| Alabama | Early March | June–September | Late November | High | Begin source reduction March 1; start larviciding April 1; apply repellents from May onward | High |
| Alaska | Early June | July | Mid-August | Moderate (tundra pools) | Brief season; personal repellent use June–August; no vector-borne disease risk | Low |
| Arizona | Mid-March | July–September (monsoon surge) | November | Low (dry); locally Moderate (monsoon) | Inspect irrigation areas from March; intensify source reduction before monsoon (June); apply Bti July–September | Moderate |
| Arkansas | Early March | June–August | Late October | High | Begin standing water control March 1; larvicide April; full personal protection May–September | High |
| California | March–April | June–September | October–November | Low–Moderate (varies) | Source reduction April; larvicide May in irrigated zones; year-round monitoring in Southern CA near coast | Moderate–High |
| Colorado | Late April | July–August | Late September | Low–Moderate | Source reduction May; larvicide June; personal protection July–August (WNV season) | Moderate |
| Connecticut | Early May | July–August | Mid-October | Moderate–High | Trap deployment April; source reduction May 1; full larvicide May; peak protection July–September | Moderate–High |
| Delaware | Late April | July–August | Mid-October | Moderate–High | Begin source reduction April; larvicide May; repellents June–September | Moderate |
| Florida | January (S. FL) / March (N. FL) | May–October | Year-round (S. FL) / December (N. FL) | Very High | Year-round monitoring in south; begin larvicide February (S. FL); full prevention April statewide | Very High |
| Georgia | Early March | June–September | Late November | High | Source reduction March 1; larvicide April; repellents and protective clothing May–October | High |
| Hawaii | Year-round | Year-round (elevated May–October) | Year-round | High | Year-round monitoring recommended; container management all 12 months; peak protection May–October | Year-Round |
| Idaho | Mid-May | July–August | Mid-September | Low–Moderate | Inspect irrigation ditches May; larvicide June–July; repellents July–August | Low–Moderate |
| Illinois | Late April | July–August | Mid-October | Moderate–High | Source reduction April; larvicide May (Cook County programs active); WNV protection July–September | Moderate–High |
| Indiana | Late April | July–August | Mid-October | Moderate | Source reduction April; larvicide May; repellent use June–September | Moderate |
| Iowa | Late April | July–August | Early October | Moderate | Begin source reduction April; larvicide May–June; peak protection July–August | Moderate |
| Kansas | Early April | June–September | Late October | Moderate | Source reduction April 1; larvicide May; WNV monitoring June–September | Moderate |
| Kentucky | Early April | June–August | Late October | Moderate–High | Begin source reduction March 15; larvicide April; repellents May–September | Moderate |
| Louisiana | Late February | May–October | Early December | Very High | Source reduction February 15; larvicide March; full prevention protocol April; year-round monitoring recommended | Very High |
| Maine | Late May | July–August | Late September | Moderate | Source reduction May; larvicide June; EEE-risk areas: avoid dusk/dawn exposure July–September | Moderate |
| Maryland | Early April | July–August | Mid-October | Moderate–High | Source reduction April 1; larvicide May; peak protection July–August; EEE watch late summer | Moderate–High |
| Massachusetts | Early May | July–September | Mid-October | Moderate | Source reduction May 1; larvicide May–June; EEE-risk zones: avoid dusk/dawn July–September | Moderate–High |
| Michigan | Early May | June–August | Late September | Moderate | Source reduction May; larvicide June; WNV monitoring July–August | Moderate |
| Minnesota | Mid-May | June–August | Late September | Moderate | Source reduction May; larvicide June; WNV protection June–August; personal repellents July | Moderate |
| Mississippi | Early March | June–September | Late November | Very High | Source reduction March 1; larvicide April; full prevention May; sustained high-risk June–October | Very High |
| Missouri | Early April | June–August | Late October | Moderate–High | Source reduction April; larvicide May; WNV protection June–August | Moderate |
| Montana | Late May | July–August | Early September | Low–Moderate | Brief season; larvicide June–July; personal repellents July–August | Low–Moderate |
| Nebraska | Late April | June–September | Mid-October | Moderate | Source reduction April; larvicide May; WNV monitoring June (NE consistently high-burden state) | Moderate–High |
| Nevada | Late March | June–September | Late October | Low (desert); Moderate (irrigated areas) | Inspect irrigation and retention ponds March; larvicide April; WNV protection June–September | Moderate |
| New Hampshire | Mid-May | July–August | Mid-October | Moderate | Source reduction May; larvicide June; EEE-risk areas: heightened protection July–September | Moderate–High |
| New Jersey | Late April | July–August | Mid-October | Moderate–High | Source reduction April; larvicide May; peak WNV and EEE protection July–September | Moderate–High |
| New Mexico | Mid-April | July–September (monsoon) | Late October | Low–Moderate | Inspect irrigation systems April; larvicide May; intensify July–September monsoon surge | Moderate |
| New York | Early May | July–August | Mid-October | Moderate | Source reduction May 1; NYC larval program active April; WNV protection July–September; EEE watch | Moderate–High |
| North Carolina | Late March | June–September | Early November | High | Source reduction March 15; larvicide April; sustained prevention May–October | High |
| North Dakota | Late May | July–August | Mid-September | Low–Moderate | Source reduction May; larvicide June; WNV monitoring July–August | Moderate |
| Ohio | Late April | July–August | Mid-October | Moderate | Source reduction April; larvicide May; WNV monitoring July–August | Moderate |
| Oklahoma | Early April | June–September | Late October | Moderate–High | Source reduction April 1; larvicide May; sustained WNV monitoring June–September | Moderate–High |
| Oregon | Early May | June–August | Mid-October | Low–Moderate | Inspect low-lying areas May; larvicide June; personal repellents June–August | Low–Moderate |
| Pennsylvania | Late April | July–August | Mid-October | Moderate | Source reduction April; larvicide May; WNV monitoring July–August (PA high-burden state 2024) | Moderate–High |
| Rhode Island | Early May | July–August | Mid-October | Moderate | Source reduction May; larvicide June; EEE-risk: avoid dusk/dawn exposure July–September | Moderate |
| South Carolina | Early March | June–September | Late November | High | Source reduction March 1; larvicide April; full personal prevention May–October | High |
| South Dakota | Early May | July–August | Late September | Low–Moderate | Source reduction May; larvicide June; WNV monitoring July–August | Moderate |
| Tennessee | Late March | June–August | Late October | Moderate–High | Source reduction March 15; larvicide April; full personal protection May–September | High |
| Texas | Mid-February (S. TX) / March (N. TX) | May–October | December (S. TX) / November (N. TX) | High (East TX) / Moderate (West TX) | Year-round monitoring S. TX; source reduction February; larvicide March; sustained high-risk May–October | Very High |
| Utah | Late April | July–August | Late September | Low–Moderate | Inspect irrigation May; larvicide June; WNV protection July–August | Moderate |
| Vermont | Mid-May | July–August | Early October | Moderate | Source reduction May; larvicide June; EEE case reported 2024 — heightened July–September protection | Moderate |
| Virginia | Early April | June–August | Late October | Moderate–High | Source reduction April 1; larvicide May; WNV and EEE watch June–September | Moderate–High |
| Washington | Early May | June–August | Mid-October | Moderate (west); Low–Moderate (east) | Source reduction May; larvicide June; irrigation monitoring east of Cascades July–August | Low–Moderate |
| West Virginia | Early April | June–August | Late October | Moderate | Source reduction April; larvicide May; personal repellents June–August | Moderate |
| Wisconsin | Early May | June–August | Late September | Moderate | Source reduction May; larvicide June; WNV and EEE monitoring July–August | Moderate |
| Wyoming | Late May | July–August | Early September | Low–Moderate | Brief season; larvicide June; personal protection July–August | Low |
Sources: NOAA NCEI 1991-2020 Climate Normals [1]; Climate Central mosquito-suitability analysis [2]; CDC ArboNET 2024 state-level case data [3]; AMCA control recommendations [8]. Season dates represent averages; local conditions vary.
Projected 2026 note: Season start dates in several Northeast states (MA, CT, NY, NJ, VT) may trend earlier than the 1991-2020 average, consistent with the multi-year warming trend documented by NOAA [1][5]. The precise magnitude of any shift cannot be forecast; this is a directional projection only, not a confirmed calendar date.
4. Mosquito Season in Different US States
#1: Mosquito Season in Florida (2026)
Due to its subtropical climate, Florida has a mosquito season almost throughout the year. The season already starts as early as February in South Florida and March, April towards the northern parts, with the highest mosquito activity from June to September when the heat, humidity, and rainfall increase. There is less mosquito activity in the winter, but it goes back up as the temperature rises over 50°F, and it often continues until November or December, especially after a storm.
Risk levels are high at all times in the whole state, with urban and coastal areas being particularly vulnerable because of the standing water left by rain or hurricanes, which provides even more breeding sites.
Florida is one of the states with the highest level of mosquito-borne diseases. These diseases include dengue (more than 50 locally transmitted cases in 2025, in addition to an increase in travel, related cases), chikungunya (starting to rise due to links with Cuba), Zika, West Nile virus (endemic), Eastern Equine Encephalitis, and occasional malaria cases in Miami, Dade and other southern counties.
Climatic shifts, including warmer temperatures from climate change and erratic rainfall after droughts, prolong seasons, boost mosquito populations via standing water, and heighten disease transmission risks.
Full details: Florida Mosquito Season (2026)
#2: Mosquito Season in Louisiana (2026)
Mosquito season in Louisiana lasts pretty much the whole year due to the humid subtropical climate. It basically starts in March when the temperature goes over 50°F, reaches the peak in May to October in the presence of intense heat, humidity, and rainfall, and finally declines in late October to November with cooler and drier weather.
A very high risk level is characteristic of southern and coastal parishes, for instance, where standing water from rivers, bayous, and storms have given birth to massive breeding grounds for mosquitoes.
Louisiana has been threatened by several mosquito-borne diseases over the years, mainly West Nile virus (WNV). West Nile virus has been endemic since 2002. In 2024, there were 57 human WNV cases and 3 deaths. The first case of 2025 was in Livingston Parish, a parish where 13 others are also known to be affected by the virus.
Besides WNV, the other diseases include St. Louis Encephalitis, Eastern Equine Encephalitis, and a very mild local risk of imported cases of dengue, chikungunya, Zika, and malaria.
Among various other factors, climatic changes play a significant role in peoples exposure to such viral infections. Climate change causes the winters to be warmer and the seasons to be longer and wetter along with expanding breeding periods and mosquito survival; hurricanes and erratic rain after droughts spike mosquito populations dramatically.
Full details: Louisiana Mosquito Season (2026)
#3: Mosquito Season in South Carolina (2026)
South Carolina’s mosquito season spans March to November in its humid subtropical climate, when temperatures range 50-95°F and humidity exceeds 42%, peaking intensely from June to September amid heat, rain, and storms.
Risk levels are high statewide, especially in coastal Lowcountry areas like Charleston and Myrtle Beach, where standing water from tides, rivers, and hurricanes creates prolific breeding sites.
Key threats include West Nile virus (endemic, with cases reported annually), Eastern Equine Encephalitis, St. Louis Encephalitis, and occasional La Crosse encephalitis; imported risks like dengue and Zika rise post-travel or outbreaks.
Warming trends have extended seasons by 11 days over 43 years, milder winters accelerate spring surges, and erratic weather—droughts followed by deluges or Tropical Storm Debby-like events—spikes populations.
Full details: South Carolina Mosquito Season (2026)
#4: Mosquito Season in Mississippi (2026)
Mississippi’s mosquito season runs from late February to mid-March through December in its warm, humid climate, peaking May to September with intense heat, Gulf moisture, and frequent rains.
Risk levels are very high statewide, particularly in coastal and Delta regions where rivers, ditches, and storms create abundant breeding sites.
Primary threats include West Nile virus (endemic, annual cases), St. Louis Encephalitis, Eastern Equine Encephalitis, and occasional La Crosse virus; low local dengue/Zika risk but imported cases post-travel.
Milder winters from warming extend activity, while droughts followed by heavy rains or hurricanes surge populations by filling low spots.
Full details: Mississippi Mosquito Season (2026)
#5: Mosquito Season in Georgia (2026)
Georgia’s mosquito season typically begins in late March to early April when temperatures consistently exceed 50°F, peaks intensely from May through September—especially June to August amid high heat, humidity, and afternoon storms—and tapers off by late October to November with cooler fall weather.
Risk levels are high statewide, particularly in coastal and metro Atlanta areas where standing water from rains and urban infrastructure fuels breeding.
Primary threats include West Nile virus (endemic with annual cases), Eastern Equine Encephalitis, St. Louis Encephalitis, and La Crosse virus; lower risks for dengue and Zika remain mostly travel-related.
Warmer winters from climate change extend seasons earlier into February and later into fall, while erratic rainfall patterns post-droughts spike populations significantly.
Full details: Georgia Mosquito Season (2026)
#6: Mosquito Season in Nebraska (2026)
Nebraska’s mosquito season starts in late May to early June after spring thaw, peaks from July to mid-September during peak summer heat and humidity, and ends with the first hard freeze in October-November.
Risk levels are moderate to high in eastern and Platte Valley regions, where irrigation ditches and rain pools breed aggressive floodwater species.
Main threats include West Nile virus (endemic; 41 human cases in 2025 from 127 positive pools across 17 counties), plus Cache Valley, Jamestown Canyon viruses, St. Louis Encephalitis, and rare Western Equine Encephalitis; low Zika/dengue risk from occasional Aedes arrivals.
Warmer springs from climate trends start seasons 1-2 weeks earlier, while intense storms create temporary breeding hotspots post-drought.
Full details: Nebraska Mosquito Season (2026)
#7: Mosquito Season in Texas (2026)
Texas’s mosquito season varies regionally but generally starts in March-April in southern areas like Houston when nighttime temperatures exceed 50°F, peaks intensely from June to September during extreme heat, humidity, and Gulf storms, and extends through November in the south—year-round in some spots.
Risk levels rank among the nation’s highest, especially in urban centers and flood-prone East/South Texas where ditches, bayous, and hurricanes spawn massive breeding.
Major threats include West Nile virus (endemic; 33 Travis County cases/2 deaths in 2024, 101 positive pools), St. Louis Encephalitis, occasional dengue/Zika from Aedes species, and Heartland virus; Houston sees imported tropical diseases regularly.
Warmer trends lengthen seasons into winter, erratic rains post-droughts explode populations 10x in days.
Full details: Texas Mosquito Season (2026).
#8: Mosquito Season in Alabama (2026)
Alabama’s mosquito season begins in February-March along the Gulf Coast when temperatures exceed 50°F, and March-April inland, peaking intensely from June to August amid scorching heat, humidity, and thunderstorms. It typically ends in October-November statewide, though coastal activity lingers until hard frosts.
Risk levels are very high, especially in humid southern counties where rivers, swamps, and urban flooding create ideal breeding grounds.
Primary threats include West Nile virus (endemic with annual cases), Eastern Equine Encephalitis, St. Louis Encephalitis, and La Crosse virus; Aedes species carry risks of Zika, dengue (mostly travel-related).
Milder winters extend early starts, while heavy rains post-droughts spike populations rapidly.
Full details: Alabama Mosquito Season (2026).
#9: Mosquito Season in North Carolina (2026)
North Carolina’s mosquito season begins in late March to early April as temperatures rise above 50°F, peaks intensely from June through August during hot, humid summers with frequent rains, and ends by late October to November after the first frost—longer in coastal areas.
Risk levels are high statewide, especially in eastern coastal plains and urban zones where swamps, ditches, and storm puddles breed aggressive species.
Key threats include West Nile virus (endemic with annual cases), La Crosse encephalitis, St. Louis Encephalitis, and Eastern Equine Encephalitis; imported dengue and Zika risks rise in travel-heavy regions.
Warmer springs start activity 1-2 weeks earlier, milder falls prolong it, and heavier rains post-droughts boost breeding surges.
Full details: North Carolina Mosquito Season (2026).
#10: Mosquito Season in Oklahoma (2026)
Oklahoma’s mosquito season starts in March with early species amid spring warms, officially ramps up in May, peaks intensely from June through August during high heat, humidity, and thunderstorms, and ends with first frosts in November.
Risk levels are high statewide, especially in eastern and urban areas where ponds, ditches, and floodwater breed over 60 aggressive species.
Primary threats center on West Nile virus (endemic; peak risk July-October with annual cases), plus St. Louis Encephalitis, Western Equine Encephalitis, and rare chikungunya; Aedes arrivals pose low Zika/dengue risk.
Milder winters trigger earlier March surges, while heavy spring rains and summer storms post-droughts explode populations rapidly.
Full details: Oklahoma Mosquito Season (2026).
#11: Mosquito Season in Delaware (2026)
Delaware’s mosquito season typically starts in late April to early May when temperatures consistently exceed 50°F, peaks from June through August during humid summers with frequent coastal rains, and ends by late October after the first hard frost—though mild falls can extend activity.
Risk levels are moderate to high, particularly in coastal and marshy areas like Sussex County where tidal wetlands and standing water breed saltmarsh species aggressively.
Primary threats include West Nile virus (monitored via statewide traps, with annual positive pools triggering sprays), Eastern Equine Encephalitis, and St. Louis Encephalitis; low local dengue/Zika risk remains mostly travel-associated.
Warmer Mid-Atlantic trends delay frosts, extending seasons, while heavier storms create breeding hotspots post-drought.
Full details: Delaware Mosquito Season (2026).
#12: Mosquito Season in Virginia (2026)
Virginia’s mosquito season starts in late March to early May when temperatures exceed 50°F, peaks intensely from June through August amid humid summers and frequent rains, and ends by late October to early November after first frosts—longer in coastal Tidewater regions.
Risk levels are high statewide, especially in eastern marshes, wetlands, and urban areas where standing water breeds over 60 species aggressively.
Key threats include West Nile virus (endemic with annual cases and positive traps), Eastern Equine Encephalitis, St. Louis Encephalitis, La Crosse encephalitis, and Jamestown Canyon virus; imported dengue/Zika risks via travel.
Milder winters trigger earlier springs, wetter patterns post-droughts spike breeding, and delayed frosts prolong fall activity.
Full details: Virginia Mosquito Season (2026).
#13: Mosquito Season in Tennessee (2026)
Tennessee’s mosquito season begins in early to mid-March when overnight temperatures hit 50°F, peaks intensely from June through August amid hot, humid summers and frequent thunderstorms, and lasts until late October or first frost.
Risk levels are high statewide, especially in western areas like Memphis where humidity exceeds 70% and standing water abounds.
Main threats include West Nile virus (endemic with annual cases), St. Louis Encephalitis, Eastern Equine Encephalitis, and La Crosse virus; Aedes species pose low local dengue/Zika risk.
Milder winters start activity earlier, while heavy rains post-droughts trigger rapid breeding surges.
#14: Mosquito Season in Kentucky (2026)
Kentucky mosquitoes awaken around late April once soils thaw and temps climb past 50°F, exploding into peak frenzy June-September when steamy heat waves and pop-up storms turn yards into breeding factories. First freezes in October finally quell the hordes, though wet falls can drag it out.
Threat? Serious in river valleys and lowlands where floodwater species thrive. West Nile virus leads the pack (endemic yearly), joined by La Crosse encephalitis and dog heartworm risks; exotic dengue stays rare.
Warmer springs now kickstart infestations 10 days early, erratic rains amplify outbreaks—hurricanes remnants hit hard.
#15: Mosquito Season in Arkansas (2026)
Arkansas mosquitoes start appearing in late February to March when temperatures rise above 50°F. The season peaks from May to September during hot, humid weather with frequent rains. It usually ends in late October or November after the first frost.
Risk levels are high, especially in low-lying areas and near rivers where standing water creates breeding sites. Main concerns include West Nile virus, which occurs yearly, along with Eastern Equine Encephalitis and occasional imported cases of Zika or dengue.
Warmer winters from climate change start the season earlier, while heavy rains after dry spells increase mosquito numbers quickly.
#16: Mosquito Season in South Dakota (2026)
South Dakota’s mosquito season kicks off in late April to early May after snowmelt when temperatures top 50°F, hits peak intensity from June through August with warm rains and humidity, and wraps up by mid-October after hard freezes.
Risks run high in eastern regions and river valleys, where temporary floodwater pools spawn aggressive Aedes vexans swarms.
West Nile virus remains the primary concern—leading national per-capita rates, with 7 human cases (1 fatal) in 2025 across multiple counties; lesser threats include Cache Valley and St. Louis Encephalitis.
Warmer springs spark earlier hatches, while intense summer downpours create explosive breeding hotspots.
#17: Mosquito Season in North Dakota (2026)
North Dakota’s mosquito season begins in late April to early May following snowmelt when temperatures exceed 50°F, peaks intensely from June through August during warm rains and high humidity, and ends by late September to mid-October with the first hard freeze.
Risk levels are very high statewide, especially in the Red River Valley and prairie potholes where floodwater pools breed massive Aedes swarms.
West Nile virus dominates threats (endemic with high per-capita cases nationally), alongside Cache Valley virus and St. Louis Encephalitis; other exotics remain rare.
Warmer springs trigger earlier hatches, while heavy thaws and summer storms create vast temporary breeding grounds.
#18: Mosquito Season in Missouri (2026)
Missouri’s mosquito season begins in late April to early May as temperatures consistently exceed 50°F, peaks from June through August during humid summers with frequent thunderstorms, and ends in late September to early October when nighttime lows drop below 50°F.
Risk levels are moderate to high statewide, particularly along rivers and in urban areas like St. Louis where standing water from rains breeds multiple species.
West Nile virus presents the main threat (endemic with regular cases), along with La Crosse encephalitis and St. Louis Encephalitis; imported tropical diseases remain uncommon.
Warmer spring trends initiate earlier activity, while summer deluges after dry periods create abundant breeding pools.
#19: Mosquito Season in Ohio (2026)
Ohio’s mosquito season starts in mid-to-late April when temperatures consistently exceed 50°F, peaks from June through August during humid summers and frequent thunderstorms, and ends by late October after the first frost.
Risk levels are moderate statewide, rising higher in wetland areas and urban neighborhoods where standing water collects in gutters and yards.
West Nile virus poses the primary threat (endemic with regular cases reported annually), alongside La Crosse encephalitis and Eastern Equine Encephalitis; tropical diseases like Zika remain rare and travel-related.
Warmer springs from shifting climate patterns trigger earlier emergences, while heavy summer downpours create abundant breeding pools after dry stretches.
#20: Mosquito Season in Pennsylvania (2026)
Pennsylvania’s mosquito season typically begins in late April to early May when temperatures consistently exceed 50°F, peaks from July through August during humid summers, and ends by late October after the first frost.
Risk levels range moderate to high, especially near wetlands, rivers, and urban areas where standing water fosters breeding.
West Nile virus remains the chief concern (endemic, prompting regular spraying in counties like Lycoming and Montgomery), with Eastern Equine Encephalitis also reported; tropical threats like Zika stay rare.
Milder springs from climate shifts spark earlier activity, while summer storms following dry spells generate widespread breeding pools.
#21: Mosquito Season in Maryland (2026)
Maryland’s mosquito season runs from March through early November, peaking June to September during humid summers and coastal rains.
Risk levels stay moderate to high statewide, especially in marshy Eastern Shore and Annapolis areas where 59 mosquito species breed in tidal wetlands and urban puddles.
West Nile virus leads threats (endemic, monitored statewide), with Eastern Equine Encephalitis and rare Zika cases; Culex species dominate late-season activity.
Climate change extends seasons via milder winters (now April-November), wetter springs creating more breeding sites after dry periods.
#22: Mosquito Season in New York (2026)
New York’s mosquito season typically begins in late April when temperatures consistently exceed 50°F, peaks intensely from July through August during hot, humid summers with frequent thunderstorms, and ends by late October after the first frost—though urban heat islands like NYC extend activity into November.
Risk levels vary regionally: moderate statewide but higher in Long Island wetlands, Hudson Valley marshes, and NYC boroughs where standing water in catch basins breeds Culex species aggressively.
West Nile virus poses the primary threat (endemic since 1999, with NYC spraying annually based on positive traps), alongside Eastern Equine Encephalitis, La Crosse encephalitis, and Jamestown Canyon virus; imported dengue/Zika risks rise via travel.
Warmer springs from climate change trigger 1-2 week earlier starts, milder falls delay freezes, and heavier rains post-winter create breeding hotspots throughout the season.
#23: Mosquito Season in Wisconsin (2026)
Wisconsin’s mosquito season starts in late May when temperatures consistently exceed 50°F, peaks from June through August during warm, humid summers with frequent lake-effect rains, and ends by late September to early October after the first frost.
Risk levels are moderate statewide but higher in northern forests and wetland areas where standing water breeds aggressive floodwater species.
West Nile virus represents the main threat (endemic with annual cases tracked by health departments), alongside La Crosse encephalitis—particularly risky for children—and Jamestown Canyon virus; tropical diseases remain rare.
Warmer springs from climate patterns trigger earlier emergences, while heavy summer thunderstorms create temporary breeding pools after dry spells.
#24: Mosquito Season in Minnesota (2026)
Minnesota’s mosquito season begins in late April to early May after snowmelt when temperatures exceed 50°F, peaks intensely from June through July during warm, wet summers, and ends by late September with the first frost.
Risk levels rank among the nation’s highest statewide, especially in northern forests, lakeshores, and metro wetlands where floodwater breeds massive Aedes swarms.
West Nile virus leads threats (endemic with regular human cases), alongside La Crosse encephalitis (notable childhood risk) and Jamestown Canyon virus; tropical imports remain rare.
Warmer springs trigger earlier hatches from climate shifts, while heavy thaws and summer storms generate widespread breeding pools.
#25: Mosquito Season in Michigan (2026)
Michigan’s mosquito season begins in late April to early May when temperatures exceed 50°F post-snowmelt, peaks intensely from June through August during warm, humid summers with frequent Great Lakes rains, and ends by late September to early October after the first frost.
Risk levels are moderate to high statewide, especially around lakeshores, wetlands, and urban areas where standing water breeds over 70 aggressive species.
West Nile virus poses the primary threat (endemic with regular human cases), alongside Eastern Equine Encephalitis, Jamestown Canyon virus, and La Crosse encephalitis; tropical imports like Zika remain rare.
Climate change extends exposure: warmer springs trigger earlier hatches, milder falls prolong activity into October, and heavy summer storms create abundant breeding pools after dry periods.
#26: Mosquito Season in California (2026)
California’s mosquito season varies widely by region. Southern areas see activity from late spring through early fall (peaking July-August), while coastal zones like San Francisco experience year-round presence with summer-fall peaks. Northern and inland regions run April-October.
Risk levels range moderate statewide but spike high in urban Southern California where invasive Aedes aegypti mosquitoes breed in tiny water containers, transmitting dengue, Zika, and chikungunya—now locally acquired cases reported annually.
West Nile virus remains endemic everywhere (hundreds of cases yearly), with St. Louis and Western Equine Encephalitis risks in rural Central Valley.
Climate change extends seasons through warmer winters, while urban heat islands and irrigation sustain year-round breeding; heavy winter rains create floodwater mosquito explosions come spring.
#27: Mosquito Season in Arizona (2026)
Arizona’s mosquito season typically begins in April when temperatures consistently exceed 50°F, peaks intensely from July through September during monsoon rains that create widespread breeding sites, and ends in late October or early November when nights cool below 50°F.
Risk levels vary: low in deserts but high in irrigated urban areas like Phoenix and Tucson where standing water in canals, gutters, and pots sustains populations year-round.
West Nile virus poses the primary threat (64 cases reported in 2025), with rising local dengue and Zika transmission from invasive Aedes aegypti mosquitoes; St. Louis Encephalitis occurs occasionally.
Warmer temperatures extend activity into winter, while monsoon deluges after dry spells generate explosive population booms.
#28: Mosquito Season in Colorado (2026)
Colorado’s mosquito season begins late April to early May when temperatures exceed 50°F after snowmelt, peaks intensely from July through September during warm monsoon rains, and ends with the first hard frost in mid-to-late October.
Risk levels are moderate statewide but higher along the Front Range and Eastern Plains where irrigation ditches and urban flooding create breeding hotspots.
West Nile virus dominates threats (endemic, with first 2025 human cases in Adams County and positive mosquitoes across five counties), alongside rare St. Louis Encephalitis; tropical diseases remain negligible.
Warmer springs trigger earlier hatches from climate shifts, while summer thunderstorms following dry periods generate temporary floodwater pools.
#29: Mosquito Season in Connecticut (2026)
Connecticut’s mosquito season runs from late May through October, peaking intensely from July to early September during humid summers with frequent thunderstorms. Trapping and testing programs operate statewide from June 2 to October end, monitoring key sites.
Risk levels are moderate but elevate in marshy coastal and eastern areas where standing water breeds Culex and Aedes species aggressively.
West Nile virus presents the primary threat (endemic; first 2025 human case September, positive pools in 34 towns), alongside Eastern Equine Encephalitis (EEE, detected in mosquitoes and deer); both prompt aerial spraying.
Warmer climate trends extend activity past first frosts, while wet springs following dry winters create persistent breeding pools.
#30: Mosquito Season in New Jersey (2026)
New Jersey’s mosquito season runs from late April through October when temperatures stay above 50°F, peaking intensely from July through early September during humid summers and coastal storms.
Risk levels remain moderate to high statewide, particularly in marshy Pinelands, tidal wetlands, and urban areas like Middlesex and Monmouth counties where standing water breeds Culex species aggressively.
West Nile virus presents the main threat (endemic; 2025 saw 6 additional cases including 2 deaths, detections in nearly all counties), alongside Eastern Equine Encephalitis found in mosquitoes across multiple counties; both trigger extensive spraying.
Warmer springs spark earlier hatches from climate trends, while summer thunderstorms after dry periods generate persistent breeding sites.
#31: Mosquito Season in Massachusetts (2026)
Massachusetts mosquito season begins in late May after snowmelt when temperatures exceed 50°F, peaks intensely from June through August during humid summers with frequent thunderstorms, and ends by late October after the first frost.
Risk levels are moderate statewide but higher in eastern marshes, Plymouth County, and Cape Cod wetlands where standing water breeds Culex and Aedes species aggressively.
West Nile virus poses the primary threat (endemic; first 2025 detection mid-June in Shrewsbury), alongside Eastern Equine Encephalitis (EEE)—4 human cases last year, mosquito positives prompting spraying; La Crosse encephalitis affects children.
Warmer springs trigger earlier hatches from climate shifts, while wetter patterns after dry winters sustain breeding pools into fall.
#32: Mosquito Season in Rhode Island (2026)
Rhode Island’s mosquito season runs June through mid-October until the first hard frost, peaking July-September during humid coastal summers.
Risk levels stay moderate statewide, higher in salt marshes and urban wetlands where Culex and Aedes breed actively.
West Nile virus leads threats (first 2025 positive in East Providence), alongside Eastern Equine Encephalitis; weekly statewide trapping triggers spraying when positives found.
Milder winters extend late-season biting, summer storms create breeding hotspots post-dry spells.
#33: Mosquito Season in New Hampshire (2026)
New Hampshire’s mosquito season begins in late May when temperatures exceed 50°F after snowmelt, peaks from June through August during humid summers with frequent thunderstorms, and ends by late September to early October with first frosts.
Risk levels are moderate statewide, higher in northern forests and wetland areas where standing water breeds aggressive species.
West Nile virus poses the primary threat (endemic with annual monitoring), alongside Eastern Equine Encephalitis and La Crosse encephalitis; late-season “elder” mosquitoes carry higher disease risk.
Warmer springs trigger earlier activity from climate shifts, while summer storms after dry periods create abundant breeding pools.
#34: Mosquito Season in Maine (2026)
Maine’s mosquito season starts in early May when temperatures exceed 50°F after snowmelt, peaks June through August during humid coastal summers, and ends by mid-October with first hard frosts.
Risk levels are moderate statewide, highest in northern forests, wetlands, and coastal salt marshes where standing water breeds aggressive Aedes and Culex species.
Key threats include West Nile virus, Eastern Equine Encephalitis (EEE), and Jamestown Canyon virus—all actively monitored with rainy 2025 conditions elevating transmission risks.
Warmer springs spark earlier hatches; heavy summer rains following dry spells create huge spikes in breeding sites.
#35: Mosquito Season in Idaho (2026)
Idaho’s mosquito season begins late April in southern valleys when temperatures exceed 50°F, peaks June through August during warm rains and irrigation runoff, and ends mid-October with first frosts.
Risk levels vary: moderate statewide but higher near rivers, lakes, and urban Boise where standing water breeds Culex and floodwater Aedes species.
West Nile virus remains the primary concern (endemic; detected annually in Ada County mosquitoes), with dog heartworm prevalent; tropical diseases stay rare.
Warmer springs initiate earlier hatches, while summer thunderstorms after dry periods create temporary breeding hotspots.
#36: Mosquito Season in Nevada (2026)
Nevada’s mosquito season starts in March in southern areas like Las Vegas when temperatures exceed 50°F, peaks intensely from May through September during monsoon rains and high humidity, and tapers off by late October.
Risk levels vary: low in high deserts but high in urban Clark County where irrigation, canals, and standing water breed Aedes aegypti and Culex species year-round.
West Nile virus dominates threats (26 human cases in 2025 including neuroinvasive forms), with St. Louis Encephalitis detected; rising dengue risk from invasive Aedes.
Climate change lengthens seasons through warmer winters, while summer monsoons create explosive breeding after arid stretches.
#37: Mosquito Season in Utah (2026)
Utah’s mosquito season begins in late April to early May when temperatures exceed 50°F after snowmelt, peaks from late June through August during irrigation runoff and monsoon rains, and ends by mid-October with consistent cold nights.
Risk levels are moderate statewide but higher near rivers, lakes, and urban valleys like Salt Lake where standing water breeds Culex species.
West Nile virus presents the main threat (endemic; monitored weekly via traps across counties), alongside dog heartworm; tropical diseases remain rare.
Warmer springs trigger earlier emergences, while summer thunderstorms create breeding hotspots after arid periods.
#38: Mosquito Season in Wyoming (2026)
Wyoming’s mosquito season begins late April to mid-May when temperatures consistently exceed 50°F after snowmelt, peaks June through August during warm rains and irrigation flows, and ends by mid-October with first hard freezes.
Risk levels stay moderate statewide but rise higher in eastern plains and river valleys where floodwater pools breed aggressive Culex species.
West Nile virus dominates threats (endemic; 11 human cases including 1 death and high mosquito activity reported in 2025 across eastern counties).
Warmer springs spark earlier hatches from climate trends, while summer thunderstorms generate temporary breeding hotspots after dry periods.
#39: Mosquito Season in Montana (2026)
Montana’s mosquito season begins late April to early May after snowmelt when temperatures exceed 50°F, peaks intensely from June through August during warm rains and high humidity, and ends by mid-September with first hard freezes.
Risk levels rank high statewide, especially in western valleys, river bottoms, and prairie potholes where floodwater breeds massive Aedes swarms.
West Nile virus poses the primary threat (endemic; active surveillance across 37 counties detects positives in mosquito pools before human cases).
Warmer springs trigger earlier hatches from climate shifts, while heavy summer thunderstorms create vast temporary breeding grounds post-dry spells.
#40: Mosquito Season in Vermont (2026)
Vermont’s mosquito season begins early May when temperatures consistently exceed 50°F, peaks June through August during humid summers with frequent thunderstorms, and ends late October after first frosts.
Risk levels remain moderate statewide, higher in wetland areas and river valleys where standing water breeds Culex species actively.
West Nile virus poses primary threat (endemic; health risk rises by July), alongside Eastern Equine Encephalitis and Jamestown Canyon virus—all monitored through weekly statewide trapping.
Warmer springs trigger earlier activity from climate shifts, while summer rains after dry periods create persistent breeding sites.
#41: Mosquito Season in Alaska (2026)
Alaska’s mosquito season starts late May to early June after snowmelt when temperatures exceed 50°F, peaks intensely June through July in interior wetlands and tundra, and ends by late August or early September with cooling weather.
Risk levels vary: low in windy coastal/mountain areas, extremely high inland where billions breed in vast temporary pools from spring thaw.
West Nile virus poses emerging threat as Culex species expand northward with warming; dog heartworm affects pets.
Climate change advances hatches earlier via warmer springs, drought-killed predators boost next-year populations.
Full details: Mosquito Season in Alaska (2026).
#42: Mosquito Season in Hawaii (2026)
Hawaii’s tropical climate supports mosquitoes year-round, with peak activity March through November during warmer, wetter months when breeding accelerates.
Risk levels stay consistently high across islands, especially in rainforests, urban valleys, and water catchments where invasive Aedes aegypti and Aedes albopictus thrive in tiny containers.
Primary threats include dengue (14 travel-related cases in 2025, first 2026 case reported), Zika, chikungunya—all locally transmissible—and avian malaria devastating native birds via Culex quinquefasciatus.
No distinct off-season exists; constant warmth sustains populations, though heavy rains boost explosive breeding.
#43: Mosquito Season in Washington (2026)
Washington state’s mosquito season begins in late May to early June after spring rains when temperatures exceed 50°F, peaks July through August during warm, humid conditions, and ends by late September or October with cooler fall weather.
Risk levels vary: moderate statewide but higher in western lowlands, Clark County wetlands, and Eastern Washington river valleys where standing water breeds over 40 species including aggressive floodwater Aedes vexans.
West Nile virus presents the primary threat (endemic detections prompting control measures), alongside rare Eastern Equine Encephalitis; dog heartworm affects pets.
Western Washington’s wet climate (150+ rainy days) sustains constant breeding sites, while warmer springs extend early activity periods.
#44: Mosquito Season in Illinois (2026)
Illinois mosquito season starts late April when temperatures consistently exceed 50°F, peaks intensely from July through early September during hot, humid summers, and ends late October after first frosts.
Risk levels stay moderate statewide but higher near Chicago, rivers, and wetlands where standing water breeds Culex species aggressively.
West Nile virus leads threats (endemic; first 2025 human case confirmed, 60% positive mosquito pools during peak), alongside La Crosse encephalitis; warmer climate extends “mosquito days” significantly.
Milder winters spark earlier springs, summer storms post-dry spells create breeding hotspots.
#45: Mosquito Season in Indiana (2026)
Indiana’s mosquito season officially runs May 1 through October 1 when temperatures stay above 50°F, peaking intensely from June through September during hot, humid summers with frequent thunderstorms.
Risk levels remain moderate statewide but higher near Chicago suburbs, rivers, and wetlands where standing water breeds Culex species aggressively.
West Nile virus poses the primary threat (endemic; 11 human cases in 2024, 10+ reported by late August 2025 including Marion County), alongside La Crosse encephalitis affecting children.
Warmer springs trigger earlier hatches from climate shifts, while heavy summer rains create explosive breeding pools after dry stretches.
#46: Mosquito Season in Iowa (2026)
Iowa’s mosquito season begins late April when overnight temperatures consistently exceed 50°F, peaks intensely from June through August during hot, humid summers with frequent thunderstorms, and ends after first hard frost in late September to mid-October.
Risk levels are moderate statewide but higher near rivers, wetlands, and urban areas where standing water breeds aggressive floodwater species.
West Nile virus poses the primary threat (endemic with annual cases), alongside La Crosse encephalitis affecting children; dog heartworm impacts pets significantly.
Warmer springs trigger earlier hatches from climate shifts, while heavy summer rains create widespread breeding pools after dry stretches.
#47: Mosquito Season in Kansas (2026)
Kansas mosquito season begins in March-April when temperatures rise above 50°F, peaks intensely from May through September during humid summers and monsoon rains, and continues until first hard frost in late October.
Risk levels are moderate statewide but higher in eastern counties and urban Wichita where irrigation ditches and storm puddles breed aggressive species.
West Nile virus presents the primary threat (endemic; peak transmission risk July-September with high mosquito activity reported weekly), alongside St. Louis Encephalitis.
Warmer springs trigger earlier emergences, while summer storms following dry periods create explosive breeding hotspots.
#48: Mosquito Season in New Mexico (2026)
New Mexico’s mosquito season typically spans March through September, driven by warm temperatures between 80-90°F and humid conditions after monsoon rains.
Activity peaks in summer across urban areas like Albuquerque and rural regions with irrigation ditches or floodwater pools, where Aedes species thrive.
West Nile virus remains the main concern, with local surveillance tracking cases; invasive Aedes aegypti heightens risks for dengue and Zika in southern counties.
Hot, dry springs delay starts, but July-August storms create breeding hotspots.
#49: Mosquito Season in Oregon (2026)
Oregon’s mosquito season typically starts in late April or May when temperatures consistently exceed 50°F (10°C), peaks from June through August in warmer valleys and eastern regions, and tapers off by September or early October after cooler nights arrive.
Western areas like Portland see moderate activity boosted by frequent rain and wetlands, while eastern high deserts face intense swarms near rivers and irrigation; over 30 species thrive statewide.
West Nile virus surveillance is active but cases remain low; floodwater mosquitoes explode after spring melts or heavy rains.
#50: Mosquito Season in West Virginia (2026)
West Virginia’s mosquito season runs from late April through October when temperatures stay above 50°F, peaking from June to September amid humid summers and heavy Appalachian rains.
Over 35 confirmed species thrive statewide, including aggressive vectors like Aedes albopictus (Asian tiger), Ae. japonicus, Ae. triseriatus, and Culex pipiens, breeding in tire tracks, ditches, and wooded pools.
West Nile virus surveillance detects endemic risks; La Crosse encephalitis threatens children in rural valleys.
Frequent storms after dry spells spark explosive populations in lowlands.
5. Regional Mosquito Season Analysis
The following sections provide detailed regional analysis of mosquito season duration, humidity conditions, climate change trends, and comparative risk profiles. The Southeast and Gulf Coast are analyzed together given their climatic similarity. Regions correspond broadly to those used in Climate Central’s mosquito-suitable day analysis [2] and NOAA’s regional climate assessments [1].
5.1 Southeast (AL, GA, FL, MS, SC, NC, TN)
Season Duration
The Southeast experiences the longest mosquito seasons in the contiguous United States. Florida’s southern peninsula supports year-round mosquito activity, with no consistent dormant period. For the broader Southeast region, the active season generally spans 8–10 months — typically from early March through late November — with very high biting pressure from May through October [2][3].
Humidity Impact
The Southeast is characterized by persistent high relative humidity throughout the active season, driven by subtropical atmospheric moisture, frequent convective rainfall, and extensive wetland and coastal environments. These conditions sustain mosquito populations at consistently high density across the entire season and support rapid population recovery after control events.
Climate Change Trend
The Southeast and Gulf Coast experience the most annual mosquito-suitable days in the nation — over 50% of the year [2]. NOAA’s 1991-2020 Normals document warmer January temperatures in Florida and Texas compared to the prior 1981-2010 period [1], indicating a reduction in the cold breaks that historically suppressed overwintering populations. Climate Central’s analysis confirms that dengue transmission season length has increased by 48% since the 1950s, with the Southeast and Florida in particular experiencing the most pronounced expansion [2].
Risk Comparison
- Florida: Very High — only state with documented year-round local dengue transmission (2024-2025); Aedes aegypti established statewide.
- Mississippi, Louisiana: Very High — among the top WNV burden states nationally; subtropical wetlands support year-round larval habitat.
- Georgia, Alabama, South Carolina: High — long season with sustained Aedes albopictus presence; Culex quinquefasciatus WNV vector widespread.
- Tennessee, North Carolina: High — expanding Aedes albopictus range; WNV and EEE both documented.
5.2 Gulf Coast (TX, LA)
Season Duration
Texas and Louisiana support some of the longest and most disease-intensive mosquito seasons in the United States. In southernmost Texas, activity can begin in mid-February and persist through December. Louisiana’s subtropical wetland environment supports high-density populations for most of the calendar year.
Humidity Impact
Persistent Gulf moisture drives high relative humidity throughout the active season in coastal areas. Inland areas of Texas experience lower humidity but compensate with intense agricultural irrigation that creates Culex tarsalis habitat independent of natural rainfall.
Climate Change Trend
NOAA’s 1991-2020 Normals document notably wetter January conditions in Texas compared to the prior 30-year period [1], extending the conditions suitable for early-season mosquito activity. Texas ranked among the highest-burden states for WNV in 2024 per CDC ArboNET provisional data [3] (specific case counts subject to revision as data are finalized), and locally acquired dengue was confirmed in Texas in 2024 [9].
Risk Comparison
- Texas: Very High — consistently leads or co-leads the nation in annual WNV cases. Local dengue and historically high arboviral burden. Gulf coastal regions: year-round risk.
- Louisiana: Very High — subtropical wetlands support near-continuous activity; substantial WNV annual burden.
5.3 Northeast (ME, NH, VT, MA, RI, CT, NY, PA, NJ)
Season Duration
The Northeast mosquito season typically spans May through October, with peak activity in July and August. However, this region has experienced a documented increase in mosquito-suitable days — more than any other U.S. region on a relative basis — since 1979 [2]. Multiple northeastern cities have gained more than a dozen additional mosquito-suitable days compared to the 1980–2009 baseline, with the range varying by location [2].
Humidity Impact
Northeastern summers are warm and humid enough to support robust mosquito populations. The region’s extensive freshwater wetlands and hardwood swamp habitats — particularly in coastal New England — create the ideal conditions for EEE transmission, which requires the swamp-adapted Culiseta melanura vector [4].
Climate Change Trend
The Ohio Valley and Northeast have experienced the largest region-wide increase in annual mosquito-suitable days since 1979 [2]. This expansion is driven by earlier spring warming, delayed fall cooling, and warmer overnight temperatures that prevent the overnight lows which previously terminated the season earlier. Aedes albopictus has become well established throughout the region and continues to expand northward.
Risk Comparison
The Northeast carries significant EEE risk; the majority of U.S. EEE cases in 2024 occurred in New England states per CDC ArboNET provisional data [3]. New Hampshire reported the highest single-state EEE burden in 2024 [3]. Pennsylvania and New York ranked among the higher-burden WNV states nationally in 2024 [3]. (Note: ArboNET 2024 case data are provisional as of this report’s publication; consult CDC for final figures.)
5.4 Midwest (IL, IN, OH, MI, MO, WI, MN, IA)
Season Duration
The Midwest mosquito season generally runs from late April through September, with the core risk period concentrated in June through August. Minnesota’s northern areas have a shorter effective season (June–August), while the southern Midwest (Missouri, southern Illinois) sees activity beginning in April and extending into October.
Humidity Impact
Humidity levels are moderate across most of the Midwest, with the Ohio Valley experiencing higher summer humidity driven by warm, moist air masses from the Gulf. Abundant agricultural landscapes provide extensive irrigation and tile-drainage infrastructure that creates persistent Culex breeding habitat.
Climate Change Trend
The Ohio Valley sub-region has seen one of the most significant increases in mosquito-suitable days in the nation [2]. NOAA’s updated normals show warmer spring temperatures in the region [1], which translates to earlier seasonal emergence of Culex pipiens and Aedes albopictus populations.
Risk Comparison
- Illinois: Moderate–High — 59 WNV cases in 2024; urban Culex pipiens dominant in Chicago metro [3].
- Minnesota: Moderate–High — 35 WNV cases in 2024; MN DOH confirms active annual surveillance program [10].
- Wisconsin: Moderate — 34 WNV cases and 1 EEE case in 2024 [3].
- Ohio, Michigan, Indiana, Iowa, Missouri: Moderate — seasonal WNV burden; standard prevention protocols apply.
5.5 Southwest (AZ, NM, NV, TX western portions)
Season Duration
The Southwest’s arid climate produces a bimodal mosquito season in many areas. A modest early spring population emerges from irrigation-dependent habitats, followed by a more significant monsoon-driven surge from July through September when precipitation creates abundant temporary breeding pools.
Humidity Impact
The Southwest is the driest region of the contiguous U.S. Relative humidity in Arizona and Nevada falls below the 42% mosquito-suitable threshold for significant portions of the year [2]. During the North American monsoon season (July–September), localized humidity rises substantially and populations surge rapidly in response to temporary standing water.
Climate Change Trend
NOAA’s 1991-2020 Normals show the southwest and south-central U.S. to be drier than the previous 1981-2010 period in some months [1]. However, warming temperatures are extending the thermal suitability window for Aedes aegypti — which has been confirmed with locally acquired dengue transmission in Arizona in 2024 [9]. Irrigation expansion and urban growth continue to create artificial breeding habitat independent of natural rainfall cycles.
Risk Comparison
- Arizona: Moderate — 31 WNV cases in 2024; first locally acquired dengue confirmed 2024.
- Nevada: Moderate — 27 WNV cases in 2024; irrigated urban environments (Las Vegas) support Culex year-round near water.
- New Mexico: Moderate — 28 WNV cases in 2024; monsoon season drives risk window.
5.6 West Coast (CA, OR, WA)
Season Duration
The West Coast mosquito season is driven primarily by irrigation infrastructure rather than natural rainfall, as dry summers in California and much of the Pacific Northwest limit natural standing water. California’s Central Valley and Southern California support the most substantial populations, with seasons spanning March–November in the south and May–October in northern California and the Pacific Northwest.
Humidity Impact
California’s Mediterranean climate produces dry summers with low humidity, but extensive irrigation creates a humidity microenvironment that sustains Culex tarsalis and Cx. pipiens populations in agricultural zones. Oregon and Washington experience more moderate summer humidity from marine influence west of the Cascades.
Climate Change Trend
California reported 123 WNV cases in 2024 — the second highest of any state — despite its dry summer climate, demonstrating that irrigation-supplemented breeding is sufficient to sustain large WNV-competent Culex populations [3]. The first locally acquired dengue cases in California’s history were confirmed in 2024, attributed to the established presence of Aedes aegypti in the Los Angeles and Fresno areas [9].
Risk Comparison
- California: High — 123 WNV cases (2024); first local dengue transmission confirmed 2024; Southern CA approaching year-round Aedes activity risk.
- Oregon: Low–Moderate — minimal WNV burden; Pacific coast humidity higher than CA but population lower.
- Washington: Low–Moderate — 1 WNV case in 2024; lower burden east of Cascades due to irrigation rather than wetland habitat.
6. Climate Change & Mosquito Season Length Trends
This section synthesizes confirmed multi-year climate and mosquito surveillance data to characterize how U.S. mosquito seasons are changing over time. All trend statements are derived from published NOAA climate data [1][5] and Climate Central’s peer-reviewed mosquito-suitable day analysis [2]. Projections are clearly labeled.
6.1 Multi-Year Trend Overview
Climate Central’s analysis of mosquito-suitable days across 242 U.S. locations since 1979 provides the most comprehensive published dataset on U.S. mosquito season trends. Their findings, based on the Yamana and Eltahir (2013) suitability framework [2]:
- More than two-thirds of the contiguous U.S. experienced an increase in annual mosquito-suitable days from 1979 to 2022 [2].
- The Southeast and South experience the most annual mosquito days — over 50% of the calendar year in many locations [2].
- The Ohio Valley and Northeast saw the largest region-wide increase in mosquito-suitable days over the analysis period [2].
- Dengue transmission season length has increased by 48% since the 1950s, with multiple transmission risk factors rising in tandem, driven by warmer and more humid conditions [2].
NOAA’s 1991-2020 Climate Normals document a national warming trend of 0.16°F per decade since 1895 [5]. January temperatures rose across most of the country in the updated normals compared to the 1981-2010 period [1]; the magnitude varies by region and should be confirmed in NOAA’s station-level data for any specific location.
| Period | NOAA Observed Temp Trend | Mosquito Season Change (Climate Central) | Key Documented Vector Impact |
| 1979–1995 (early baseline) | Warming trend established; 0.16°F/decade since 1895 [5] | Reference period for Climate Central analysis [2] | WNV not yet present in U.S.; Ae. albopictus established Southeast |
| 1996–2010 | Continued warming; NOAA 1981-2010 normals reflect warming vs. 1971-2000 [1] | Modest increases in mosquito days in mid-latitudes; SE continues to lead nationally [2] | WNV arrives 1999; spreads to all 48 states by 2004; Ae. albopictus expanding northward |
| 2011–2020 | NOAA 1991-2020 normals document warmer January across most of U.S. vs. 1981-2010 [1] | Northeast cities gain 10-17+ additional mosquito-suitable days vs. 1980-2009 baseline [2] | EEE outbreak 2019 (38 cases); local dengue emerges in TX, FL; Ae. albopictus reaches New England |
| 2021–2024 (most recent) | Continued warming; 2023 and 2024 among warmest years on record globally [5] | Vermont: 17+ more mosquito days vs. baseline; Ohio Valley continues high-increase trend [2] | Local dengue 2024 in CA, AZ, FL, TX (first-ever in CA and AZ); EEE above average 2024 (19 cases) [3][9] |
| Projected 2026 (Estimate) | Continued warming expected under all scenarios per IPCC AR6 [11] | Season lengthening projected to continue in Northeast, Midwest, and Pacific Northwest [2] | Projected: continued Ae. aegypti/albopictus range expansion; elevated dengue and WNV risk in newly affected areas |
6.2 Earlier Spring Onset in Southern States
NOAA’s analysis of 1991-2020 vs. 1981-2010 Climate Normals documents that January temperatures rose in Texas and Florida [1], with the specific magnitude varying by station. In practical terms, this reduces the duration of the cold break that limits early-season mosquito survival, enabling winter-surviving adults and winter-hardy eggs to become active earlier in the calendar year. In South Florida and South Texas, this has effectively eliminated any meaningful dormant period for some Aedes and Culex populations.
For the Gulf Coast, this earlier onset extends the high-burden risk window by weeks at both ends of the traditional season. Vector control programs in Texas and Louisiana have adapted by initiating surveillance and larviciding operations as early as February in some years, compared to March or April in prior decades.
6.3 Impact of Increased Rainfall Events
NOAA’s updated normals show that precipitation normals were generally wetter east of the Rockies during 1991-2020 than the prior period [1]. Intensification of rainfall events — more precipitation delivered in fewer, heavier events — has direct implications for mosquito breeding.
Heavy rainfall creates widespread temporary standing water that is difficult to control through source-reduction alone, stimulating population spikes that lag storms by approximately 7-14 days at peak-season temperatures.
In Florida, Louisiana, and Texas, the combination of warmer base temperatures and periodic extreme rainfall events from tropical systems creates conditions for exceptionally high-density seasonal populations in affected years.
6.4 Season Length: Confirmed vs. Projected
| State/Region | Approx. Season 1990s | Approx. Season 2020s (Observed) | Projected 2030s-2050s | Data Basis |
| Vermont (example NE city) | ~130 mosquito days/yr (est.) | ~147+ mosquito days/yr [2] | Possible 150-170 days/yr [2] | Climate Central [2] |
| South Florida | Year-round with brief cool breaks | Year-round; fewer cool-day interruptions | Year-round; increasingly continuous | NOAA [1]; Climate Central [2] |
| Ohio Valley region | ~140-155 days/yr (est.) | Region shows large increase vs. 1979 [2] | Further increases projected | Climate Central [2] |
| Desert Southwest (AZ, NV) | ~100-130 days/yr in irrigated zones | Similar total but dengue risk newly present [9] | Longer thermal window for Ae. aegypti | CDC [9]; Climate Central [2] |
| Contiguous U.S. average | Varies widely by region | >2/3 of locations show increase since 1979 [2] | Further increases projected under continued warming | Climate Central [2]; IPCC AR6 [11] |
Note: Season length comparisons for individual states are approximations based on Climate Central’s published regional findings. Station-specific data available at climatecentral.org. Projected figures are directional estimates, not precise forecasts.
📰 Must Read,
✔️ Essential Lawn Care Practices to Reduce Mosquito Hiding Spots?
✔️ How to Apply Mosquito Spray for Maximum Protection?
7. Best Prevention Timing by Climate Zone
The following prevention guidance is organized by climate zone and season phase. Recommendations are based on CDC personal protection and source-reduction guidance [4], AMCA integrated vector management (IVM) principles [8], and EPA-registered control method endorsements [12].
Prevention timing should be adjusted based on local temperature observations in any given year; use the 50°F threshold as the practical guide to when active prevention becomes necessary.
7.1 Zone Definitions for Prevention Timing
| Climate Zone | States | Season Phase Reference |
| Tropical / Subtropical (Year-Round) | Hawaii, Puerto Rico, U.S. territories, South Florida (Miami-Dade, Broward, Palm Beach) | Year-round prevention required; no true off-season |
| Warm Humid (Long Season, 8-10 months) | FL (most), TX, LA, MS, AL, GA, SC, AR, TN, NC, OK (eastern) | March–November core; begin February in southernmost areas |
| Humid Temperate (Mid-Season, 6-8 months) | VA, MD, DE, NJ, CT, NY, PA, OH, IN, IL, MO, KS, NE, NC (western) | April–October core; begin March in southern portions |
| Continental (Standard Season, 5-7 months) | MN, WI, MI, IA, SD, ND, MT (east), CO, NM, NV, UT, ID (irrigated) | May–September core; begin April in southern portions of these states |
| Arid / Semi-Arid (Irrigation + Monsoon) | AZ, NM, NV, western TX, CA (inland) | March–November in irrigated zones; July–September monsoon surge |
| Pacific Maritime (Moderate, 5-6 months) | WA, OR, CA (coast and northern) | May–October core; dependent on irrigation in CA |
| Short Season (Mountain / Northern) | AK, MT (west), WY, CO (mountain), ID (mountain), ME (northern) | June–August; personal protection primary; brief intensive window |
7.2 Early-Season Actions (Season Start through 4 Weeks Before Peak)
Early-season prevention focuses on eliminating breeding habitat before adult populations establish. These actions have the highest return on investment — removing larval habitat prevents exponential adult population growth that is far more difficult to address once established.
- Conduct property inspection for standing water sources: birdbaths, clogged gutters, low-lying areas, tarps, tires, flower pots, and drainage features. Remove or treat all sources holding water for more than 5-7 days [4][8].
- Apply EPA-registered larvicides (Bacillus thuringiensis israelensis [Bti] or methoprene) to unavoidable standing water (retention ponds, rain barrels, catch basins, ornamental water features) [12].
- Coordinate with local mosquito abatement district or county health department to confirm whether community-wide larviciding programs are active in your area [8].
- Ensure window and door screens are intact and properly fitted [4].
- Stock EPA-registered repellents (DEET, Picaridin, IR3535, OLE/PMD, or 2-Undecanone) before peak-season demand [4].
- Tropical/subtropical zones: Skip this step — early-season and late-season are the same; maintain year-round protocols.
7.3 Peak-Season Protection Strategy (July–August Nationally; May–October in South)
Peak-season prevention addresses both personal protection and community-level vector suppression simultaneously. The strategies below align with CDC and EPA recommendations [4][12].
| Protection Category | Specific Action | Recommended Timing |
| Personal Repellent | Apply EPA-registered repellent (DEET 20-30%, Picaridin 20%, IR3535, OLE 30%+, or 2-Undecanone) to exposed skin and clothing at all outdoor events | Every outdoor exposure during peak months; reapply per label |
| Clothing Protection | Wear long-sleeved shirts and pants; treat outdoor clothing with permethrin (do not apply to skin); pre-treated garments available commercially | Extended outdoor activities; dawn/dusk hours especially |
| Breeding Control | Empty and scrub all water-holding containers weekly (birdbaths, planters, buckets); treat unavoidable standing water with Bti | Weekly throughout peak season |
| Larvicide Cycle | Reapply Bti or methoprene to standing water every 7-14 days or after significant rainfall resets population cycles | Following each 0.5+ inch rainfall event and on a 14-day schedule |
| Outdoor Timing | Avoid outdoor activity at dawn and dusk when Culex species are most active; Aedes species bite during the day — protection required all daylight hours in dengue-risk areas | Daily throughout peak season |
| Screening | Repair or add window screens; use fans in screened areas (wind deters mosquito flight) | Before peak season; maintain throughout |
| Medical Awareness | Recognize WNV symptoms (fever, headache, body aches); seek medical care for any severe neurological symptoms; report suspected mosquito-borne illness to local health department | Throughout season; especially July–September WNV peak |
7.4 Late-Season Prevention Adjustments (September–November by Region)
Late-season prevention is often overlooked, yet the period from September through October remains clinically significant for WNV transmission. CDC ArboNET data show that WNV neuroinvasive disease cases are frequently reported through September and into October in southern states [3]. EEE transmission historically peaks in late August and September in New England [3].
- Southern states (FL, TX, LA, MS): Continue all peak-season protocols through October; Gulf Coast: extend through November. Dengue-risk states: sustain prevention as long as Aedes activity is confirmed.
- Mid-Atlantic and Midwest: Maintain repellent use and weekly standing water checks through early October; scale back once sustained nighttime temperatures remain below 50°F.
- Northeast: EEE-risk areas should sustain dawn/dusk outdoor avoidance through September. WNV risk continues in NY, NJ, PA through September.
- Northern and Mountain states: Prevention can generally conclude after first hard frost (temperatures at or below 28°F). Source-reduction in spring before overwintering eggs hatch is more important than fall prevention in these regions.
- Year-round zones (FL south, HI, territories): Maintain continuous monitoring and prevention; use seasonal intensity modulation — highest intensity May–October, maintenance protocol November–April.
8. Methodology
8.1 Data Sources Used
This guide was compiled exclusively from primary government data, peer-reviewed publications, and published market research. No unattributed online content was used as a data source.
All figures that appear as confirmed data carry a numbered citation traceable to a specific document. Journalists citing this guide should verify all case count figures directly against current CDC ArboNET data, as provisional surveillance figures are subject to revision after the close of each reporting year.
Climate projections are clearly labeled as estimates throughout; they should not be attributed as confirmed forecasts.
| Source | Data Provided | Ref. |
| NOAA NCEI 1991-2020 U.S. Climate Normals | 30-year temperature and precipitation baselines; seasonal climate characterization; humidity patterns by region | [1] |
| NOAA Climate.gov — Climate Change and 1991-2020 Normals | National warming trend (0.16°F/decade since 1895); January temperature changes vs. prior normals; regional precipitation shifts | [5] |
| Climate Central — Mosquito Days Analysis (Yamana & Eltahir 2013 framework) | Mosquito-suitable day counts for 242 U.S. locations since 1979; regional trend data; humidity threshold (42% RH); dengue season length change (48% increase since 1950s) | [2] |
| CDC ArboNET Surveillance System (2024 provisional, as of Jan 16, 2026) | State-level WNV, EEE, dengue case counts; seasonal case timing data; disease risk calibration | [3] |
| CDC — About Mosquitoes in the United States | Species distribution; control method recommendations; personal protection guidance | [4] |
| AMCA (American Mosquito Control Association) | Integrated vector management principles; biology documentation; prevention timing frameworks | [8] |
| EPA — General Information about Mosquitoes and Vector Control | EPA-registered larvicide and adulticide guidance; control method endorsements | [12] |
| PMC / Environmental Health Perspectives: Thermal Biology of Ae. aegypti and Ae. albopictus | Temperature thresholds (10°C lower bound; 10-35°C flight range); humidity-survival relationships | [7] |
| Central Massachusetts Mosquito Control Project — Where Do Mosquitoes Go in Winter? | Temperature threshold documentation (50°F; 80°F optimal; 60°F lethargic; below 32°F lethal) | [6] |
| MN Dept. of Health — WNV Statistics 2024 | Minnesota-specific case count verification (35 WNV cases, 2024) | [10] |
| CDC HAN-00523 (March 2025) and MMWR dengue report (Feb 2025) | Local dengue transmission states 2024 (FL, TX, CA, AZ); Puerto Rico outbreak data | [9] |
| IPCC Sixth Assessment Report (AR6) | Temperature projection scenarios referenced for long-range projections | [11] |
8.2 How Season Timing Was Determined
State mosquito season start and end dates in Section 3 were determined through a three-factor assessment. These dates represent averages derived from multi-decade climate normals and surveillance patterns; they are not official government-issued season calendars, and local conditions will vary. Journalists should treat all season dates as generalized approximations, not precise thresholds:
- Temperature threshold alignment: Using NOAA 1991-2020 Climate Normals for each state’s primary climate region, the approximate calendar date when mean daily temperatures consistently exceed 50°F in spring (season start) and consistently fall below 50°F in autumn (season end) was identified [1].
- Climate Central suitability calibration: Season duration estimates were cross-referenced with Climate Central’s published mosquito-suitable day counts for representative cities in each state, using the dual threshold of temperature (50-95°F) and humidity (≥42% average relative humidity) [2].
- CDC surveillance pattern verification: Peak month designations were cross-referenced with CDC ArboNET seasonal case distribution data, which reflect actual human disease onset dates and serve as a practical proxy for peak transmission season [3].
No single federal database publishes official start/end dates for mosquito season by state. All dates in this report represent averages derived from the above methodology; local conditions vary by elevation, microclimate, and land use. Inter-annual variability can shift season boundaries by 2-4 weeks in either direction.
8.3 Limitations
- No official season calendar: State mosquito season dates are not standardized by any federal agency. Dates herein are averages; they do not constitute authoritative government definitions.
- Humidity classifications are qualitative: Humidity Level categories (Low/Moderate/High) are regional qualitative characterizations derived from NOAA Climate Normals. They do not represent precise measured relative humidity values at specific locations. NOAA NCEI’s station-level data should be consulted for precise figures.
- Climate data vs. mosquito counts: Temperature and humidity data do not directly equal mosquito population density. Other factors — land use, hydrology, mosquito control program efficacy, and species composition — also determine actual population levels.
- Urban-rural variation not captured in state-level table: The state table presents state-wide average conditions; urban areas within a state may have longer effective seasons due to heat island effects [2], while high-elevation rural areas may have shorter seasons.
- Disease risk ≠ nuisance risk: Risk Level in Section 3 reflects both bite frequency and vector-borne disease history. Some low-nuisance states may have elevated disease risk (e.g., Nebraska — high WNV burden despite moderate density); this is captured in notes.
- 2026-specific data: 2026 season data are not yet available as of this report’s publication date. All 2026 references are projections based on documented multi-year trends, not confirmed seasonal observations.
8.4 Distinction Between Surveillance Data and Projections
This report uses the following labeling convention throughout:
- Confirmed data: Figures drawn directly from primary sources (NOAA, CDC, Climate Central) and labeled with a citation number in square brackets [n].
- Projections / Projected 2026 Estimate: Forward-looking statements derived from documented trends. Clearly labeled as projections throughout the text.
- Qualitative characterizations: Assessments (e.g., humidity levels, density ratings) that are derived from climate normals and surveillance patterns but cannot be expressed as a single precise value. These are identified as qualitative in the text.
📰 Must Read,
✔️ US Mosquito Statistics 2026: State-by-State Data, Mosquito Season, Disease Trends & Bite Rates
✔️ 12 Hacks to Make Your Mosquito Spray Last Longer Outdoors
Frequently Asked Questions (FAQs)
Which states have year-round mosquito seasons?
Hawaii is the only U.S. state with a documented year-round mosquito season, given its tropical climate and absence of seasonal temperature drops below 50°F [1][2].
In the continental United States, South Florida (specifically the Miami-Dade, Broward, and Palm Beach tri-county area) effectively maintains year-round mosquito activity; Aedes aegypti populations are active throughout the calendar year in this region, and local dengue transmission has been confirmed in both 2024 and 2025 [9].
Puerto Rico, the U.S. Virgin Islands, and other U.S. territories also support year-round mosquito populations and vector-borne disease transmission. Southern portions of Texas (Lower Rio Grande Valley) and Louisiana approach year-round activity, with only brief cold breaks in most winters.
When should mosquito prevention start in southern states?
Prevention timing in the Southeast and Gulf Coast should begin substantially earlier than many residents expect. In South Florida and South Texas, source-reduction and larvicide programs should be active by February [1][2]. Across the broader Southeast (Alabama, Georgia, Mississippi, Louisiana, South Carolina), standing water control should begin by March 1, with larvicide applications starting in early April and full personal protection protocols (repellent, screening, protective clothing) in effect by May [8][4].
This early-start approach reflects the documented shift toward earlier spring mosquito activity driven by warming winter temperatures under the NOAA 1991-2020 Climate Normals [1][5]. For Gulf Coast communities, initiating prevention at least 6-8 weeks before the expected peak provides the best population suppression benefit.
Are mosquito seasons getting longer in the United States?
Yes, based on published data. Climate Central’s analysis of mosquito-suitable days across 242 U.S. locations since 1979 found that more than two-thirds of the contiguous U.S. experienced an increase in annual mosquito-suitable days over the 43-year study period [2].
The Ohio Valley and Northeast saw the largest region-wide increases. Individual cities in Vermont and other northeastern states have gained more than a dozen additional mosquito-suitable days compared to the 1980–2009 baseline, with the specific amount varying by location [2]. The dengue transmission season length has increased by 48% since the 1950s [2].
NOAA documents that the 1991-2020 Climate Normals reflect warmer January temperatures across most of the country compared to the prior 1981-2010 period [1], which directly translates to earlier seasonal mosquito emergence and later season end dates in affected regions. Projected 2026 Estimate: This trend is expected to continue under all published climate warming scenarios.
How does humidity affect mosquito activity and bite rates?
Humidity is a critical secondary driver of mosquito survival and activity — second only to temperature. Mosquitoes have a high surface-area-to-volume ratio and desiccate rapidly in low-humidity environments. The Climate Central mosquito-suitability framework, based on published research by Yamana and Eltahir (2013), defines a mosquito-suitable day as requiring average relative humidity of 42% or greater in addition to appropriate temperature [2]. When humidity falls below this threshold, even temperature-suitable days become hostile to mosquito survival and activity.
This explains why desert states like Nevada and Arizona have fewer effective mosquito days than their summer temperatures alone would suggest, while the Southeast’s persistent high humidity enables dense populations throughout a much longer season. High humidity (broadly above 60%) extends individual mosquito lifespan, increases the frequency of blood-feeding, and accelerates pathogen replication within the mosquito — all of which elevate disease transmission risk.
Which region has the shortest mosquito season, and which has the longest?
The shortest mosquito seasons in the United States occur in Alaska and high-elevation areas of the Mountain West (Wyoming, Montana, Colorado mountain zones), where the effective season may be limited to 6-10 weeks — typically July through mid-August [1][2]. Alaska’s nuisance mosquito season is real but brief; no mosquito-borne diseases are documented as locally transmitted in the state. At the opposite extreme, South Florida and Hawaii experience the longest seasons — effectively year-round [2].
Among the contiguous 48 states, the Southeast and Gulf Coast (Florida, Louisiana, Texas, Mississippi, Alabama, Georgia) consistently have the most annual mosquito-suitable days, exceeding 200 in many locations — more than 50% of the calendar year [2]. The contrast between these extremes underscores why national prevention messaging must be regionally tailored: a single calendar recommendation cannot serve both a homeowner in Anchorage and one in Miami.
References:
[1]NOAA National Centers for Environmental Information (NCEI). 1991-2020 U.S. Climate Normals. Released May 2021 (v1.0.0); reissued 2023 (v1.0.1). Available at: https://www.ncei.noaa.gov/products/land-based-station/us-climate-normals. Accessed February 2026.
[2] Climate Central. Mosquito Days Analysis. 2023. Based on Yamana TK, Eltahir EAB (2013) frameworks. Available at: https://www.climatecentral.org/climate-matters/mosquito-days-2023. Accessed February 2026. (‘Mosquito-suitable days’ defined as temperature 50-95°F and average relative humidity ≥42%.’)
[3] Centers for Disease Control and Prevention (CDC). ArboNET Surveillance System. West Nile Virus and Other Nationally Notifiable Arboviruses — United States, 2024. Provisional data as of January 16, 2026. Available at: https://www.cdc.gov/west-nile-virus/data-maps/historic-data.html.
[4] Centers for Disease Control and Prevention (CDC). About Mosquitoes in the United States. Updated June 4, 2024. Available at: https://www.cdc.gov/mosquitoes/about/about-mosquitoes-in-the-united-states.html.
[5] NOAA Climate.gov. Climate Change and the 1991-2020 U.S. Climate Normals. April 19, 2021. Available at: https://www.climate.gov/news-features/understanding-climate/climate-change-and-1991-2020-us-climate-normals. (National warming trend: 0.16°F per decade since 1895.)
[6] Central Massachusetts Mosquito Control Project (CMMCP). Where Do Mosquitoes Go in Winter? Available at: https://www.cmmcp.org/mosquito-information/faq/where-do-mosquitoes-go-winter. Accessed February 2026. (‘Mosquitoes function best at 80°F, become lethargic at 60°F, and cannot function below 50°F.’)
[7] Delatte H, et al. (review updated); Mordecai EA, et al. Effects of Environmental Temperature on Aedes aegypti and Aedes albopictus Mosquitoes — A Review. PMC / Environmental Health Perspectives. Available at: https://pmc.ncbi.nlm.nih.gov/articles/PMC6316560/.
[8] American Mosquito Control Association (AMCA). Mosquito Information: Biology and Control. Available at: https://www.mosquito.org/mosquito-information/. Accessed February 2026.
[9] Centers for Disease Control and Prevention (CDC). Health Alert Network HAN-00523: Ongoing Risk of Dengue Virus Infections and Updated Testing Recommendations in the United States. March 2025. Available at: https://www.cdc.gov/han/php/notices/han00523.html. (Local dengue transmission 2024: FL, TX, CA, AZ.)
[10] Minnesota Department of Health. West Nile Virus Maps and Statistics. 2024 Season Data. Available at: https://www.health.state.mn.us/diseases/westnile/statistics.html. Accessed February 2026.
[11] Intergovernmental Panel on Climate Change (IPCC). Sixth Assessment Report (AR6), Working Group I: The Physical Science Basis. 2021. Available at: https://www.ipcc.ch/report/ar6/wg1/.
[12] U.S. Environmental Protection Agency (EPA). General Information about Mosquitoes. Updated July 10, 2025. Available at: https://www.epa.gov/mosquitocontrol/general-information-about-mosquitoes.